 Try ShortPoint now
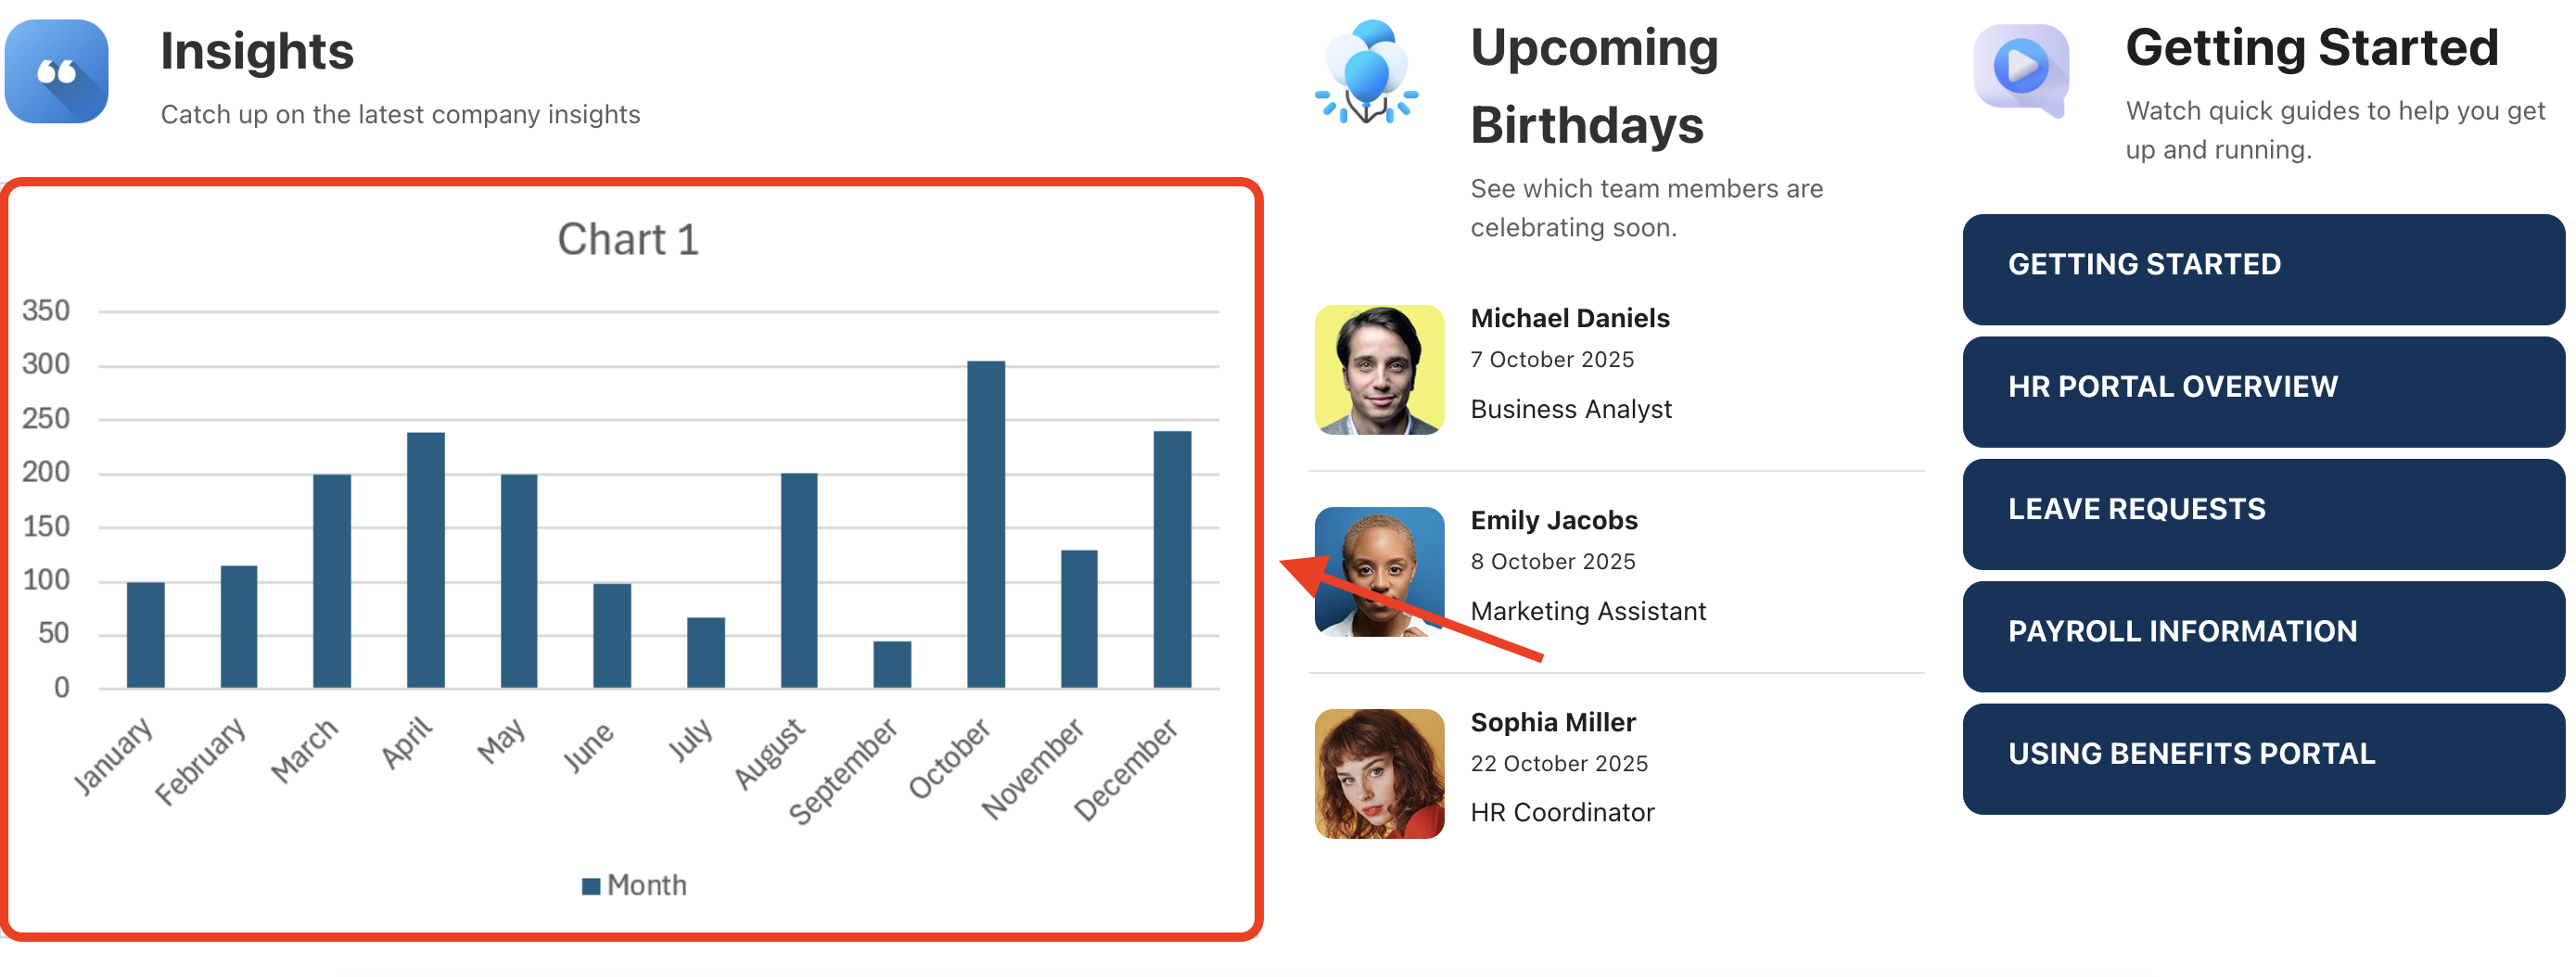
Having the ability to visualize data right where your team collaborates is extremely useful. This is where the Microsoft Graph API connection comes in!
With it, you can display Excel charts in SharePoint, transforming complicated data into meaningful insights at a glance.
This article will demonstrate how to leverage the Microsoft Graph API connection to bring your charts into SharePoint.

TABLE OF CONTENTS
- Prerequisites
- What is the “Chart Image in Worksheet” Use Case?
- Step-by-step Tutorial
- Step 1: Edit the ShortPoint Web Part
- Step 2: Edit the Design Element
- Step 3: Open the Connect Window
- Step 4: Connect to Microsoft Graph API
- Step 5: Use the Chart Image in Worksheet Use Case
- Step 6: Get File ID
- Step 7: Get Worksheet Name
- Step 8: Get Chart ID
- Step 9: Customize Height and Width
- Step 10: Connect
- Step 11: Map Items
- Step 12: Save
- Frequently Asked Questions
Prerequisites
- You must have ShortPoint SPFx version 8.6.0.0 and up installed.
- You also need to be a ShortPoint Designer with either a Pro or Enterprise license. For more details, check out Licensing Options.
- You must have the Microsoft Graph API connection enabled. Go to How to Enable Microsoft Graph Integration for MS Graph API Connections to learn how.
- You must authorize the necessary permissions (Files.Read) in the API access page. To check, go to your SharePoint Admin Center > Advanced > API access.
- You must have the Design Element you want to use to connect on your SharePoint page. For best results, we recommend using Design Elements that allow image display (Image, Slideshow, Image Caption, etc.)
- You must already have an Excel file with charts in it.
What is the “Chart Image in Worksheet” Use Case?
The Chart Image in Worksheet use case leverages a Microsoft Graph API GET query to fetch a live version of a chart in a specific Excel file stored in your SharePoint site or OneDrive. The API processes the Excel file and returns the chart as a Base64-encoded image string.

With this use case, you aren't just looking at a static picture of your chart; you are looking at a dynamically generated image of your latest data point. You can even customize the height and width to make sure the chart looks perfect on your modern page in SharePoint.
The typical structure of this use case is:
https://graph.microsoft.com/v1.0/me/drive/items/#fileId/workbook/worksheets('#worksheetFileName')/charts('#chartId')/Image(width=200,height=200,fittingMode='fit')Where you need to get the following parameters:
- File ID - is a unique identifier associated with a particular SharePoint file.
- Worksheet File Name - is a unique identifier associated with a particular Excel worksheet.
- Chart ID - is a unique identifier associated with a chart in an Excel worksheet.
- Width - allows you to set your desired chart width.
- Height - allows you to set your desired chart height.
You must enable the following permissions in the SharePoint Admin Center to use it:
- Files.Read - this permission grants the app access to read your files.
NOTEIf you haven’t given access to the permissions above, go to your SharePoint Admin Center > Advanced > API access.
Step-by-step Tutorial
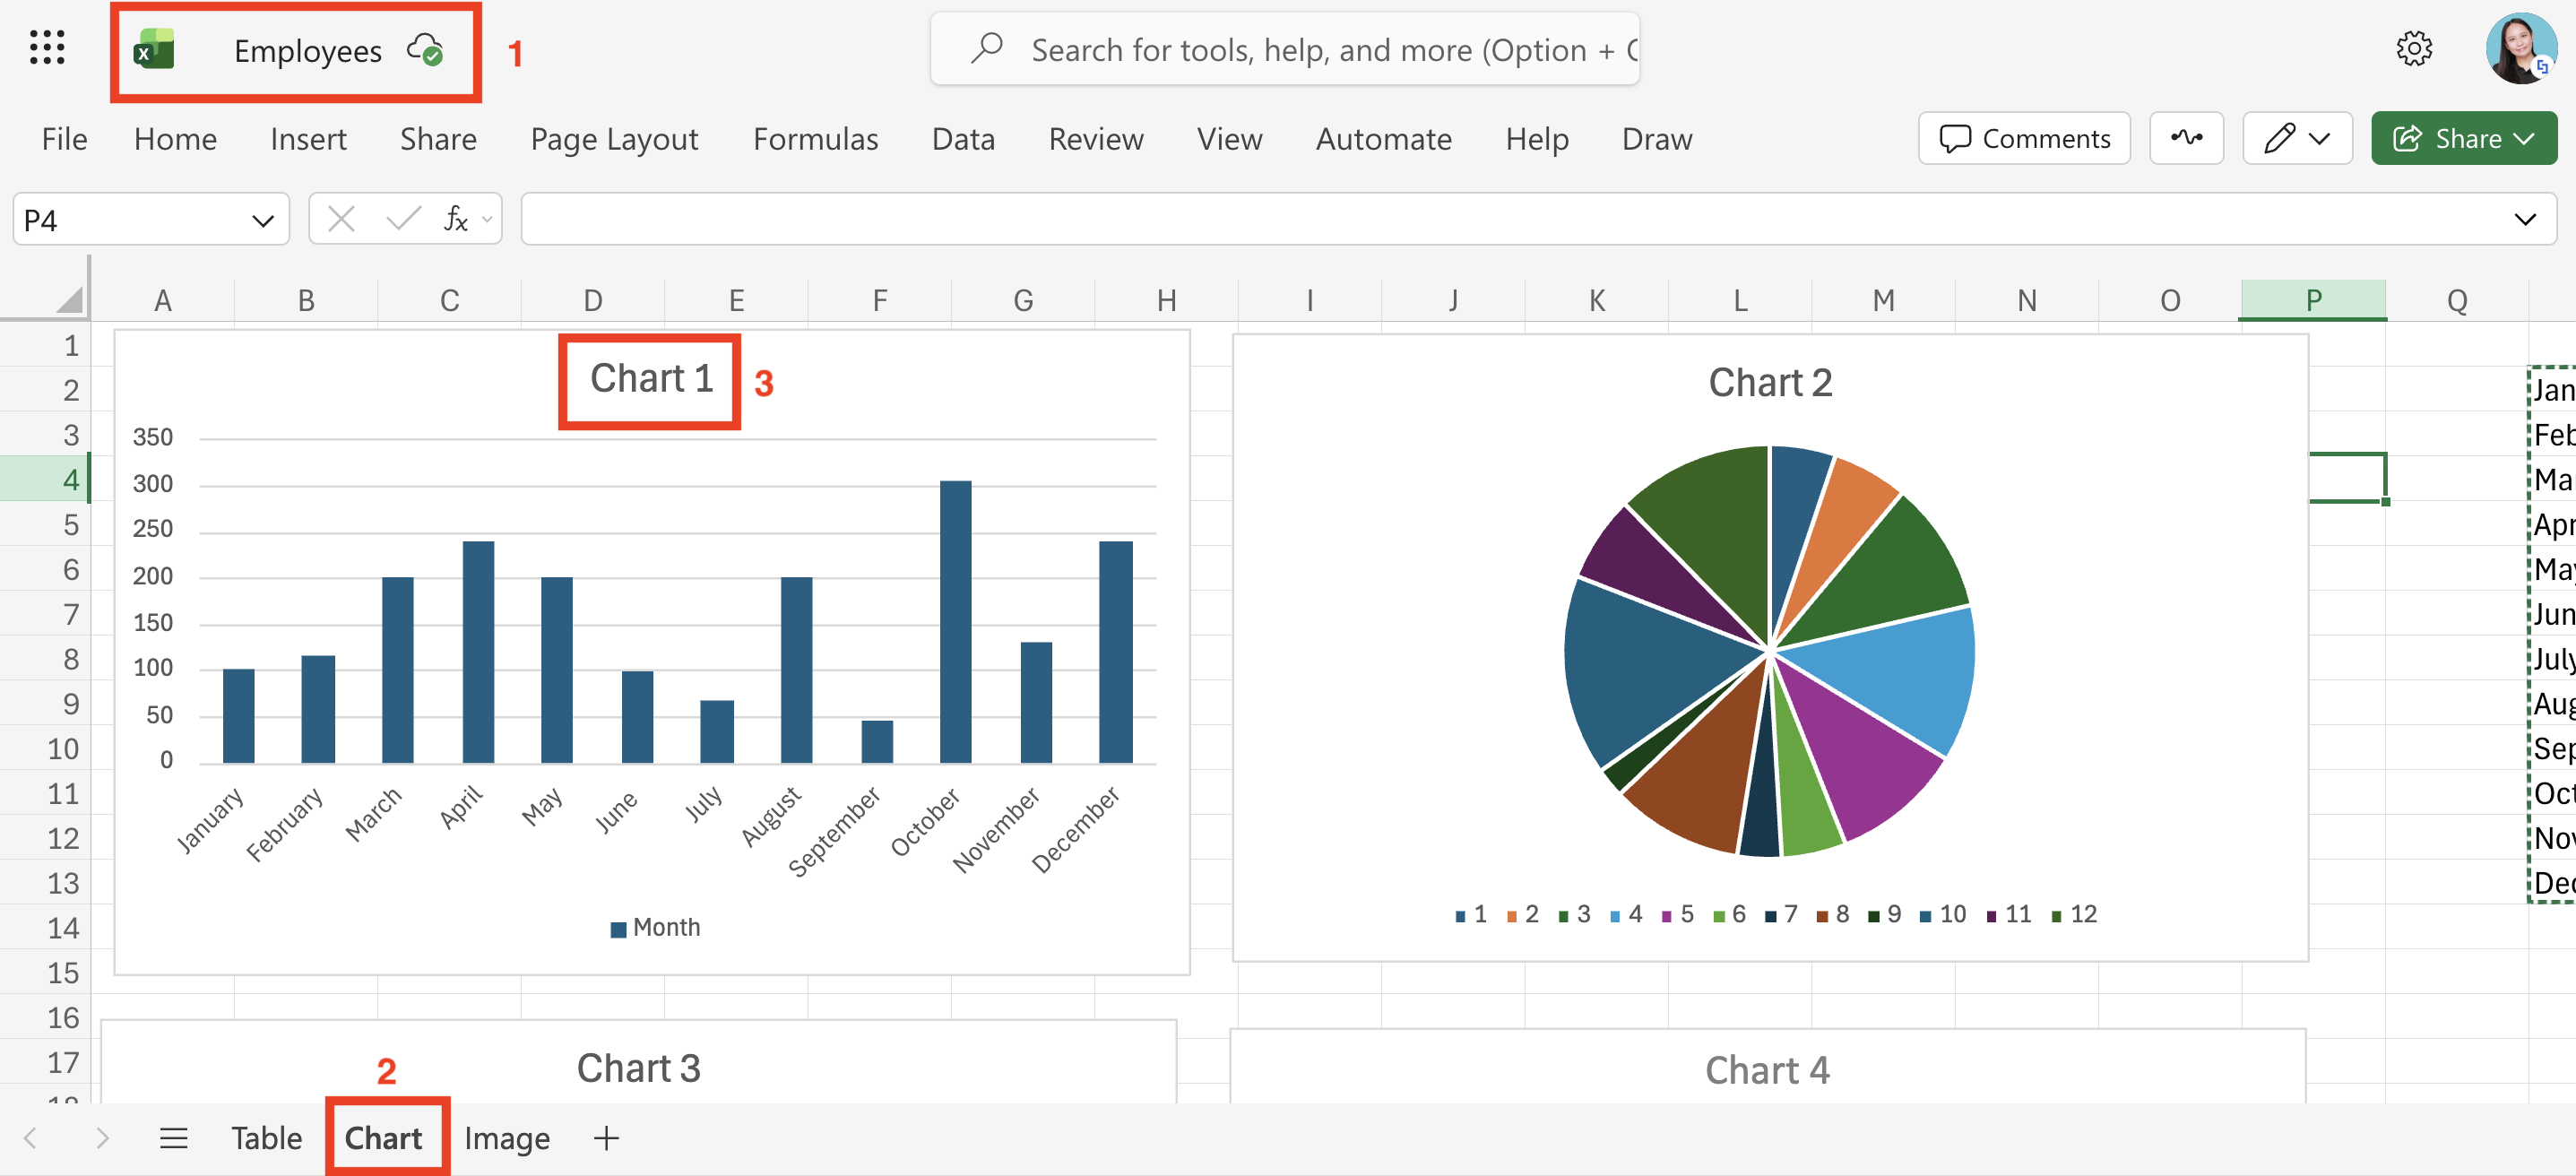
Follow the steps below to learn how to use the Chart Image in Worksheet use case. For this guide, we’ll use the Excel file below. You will need to take note of the following data points in your Excel file, as you’ll need them to accomplish the steps:
- File Name
- Worksheet Name
- Chart Name
Step 1: Edit the ShortPoint Web Part
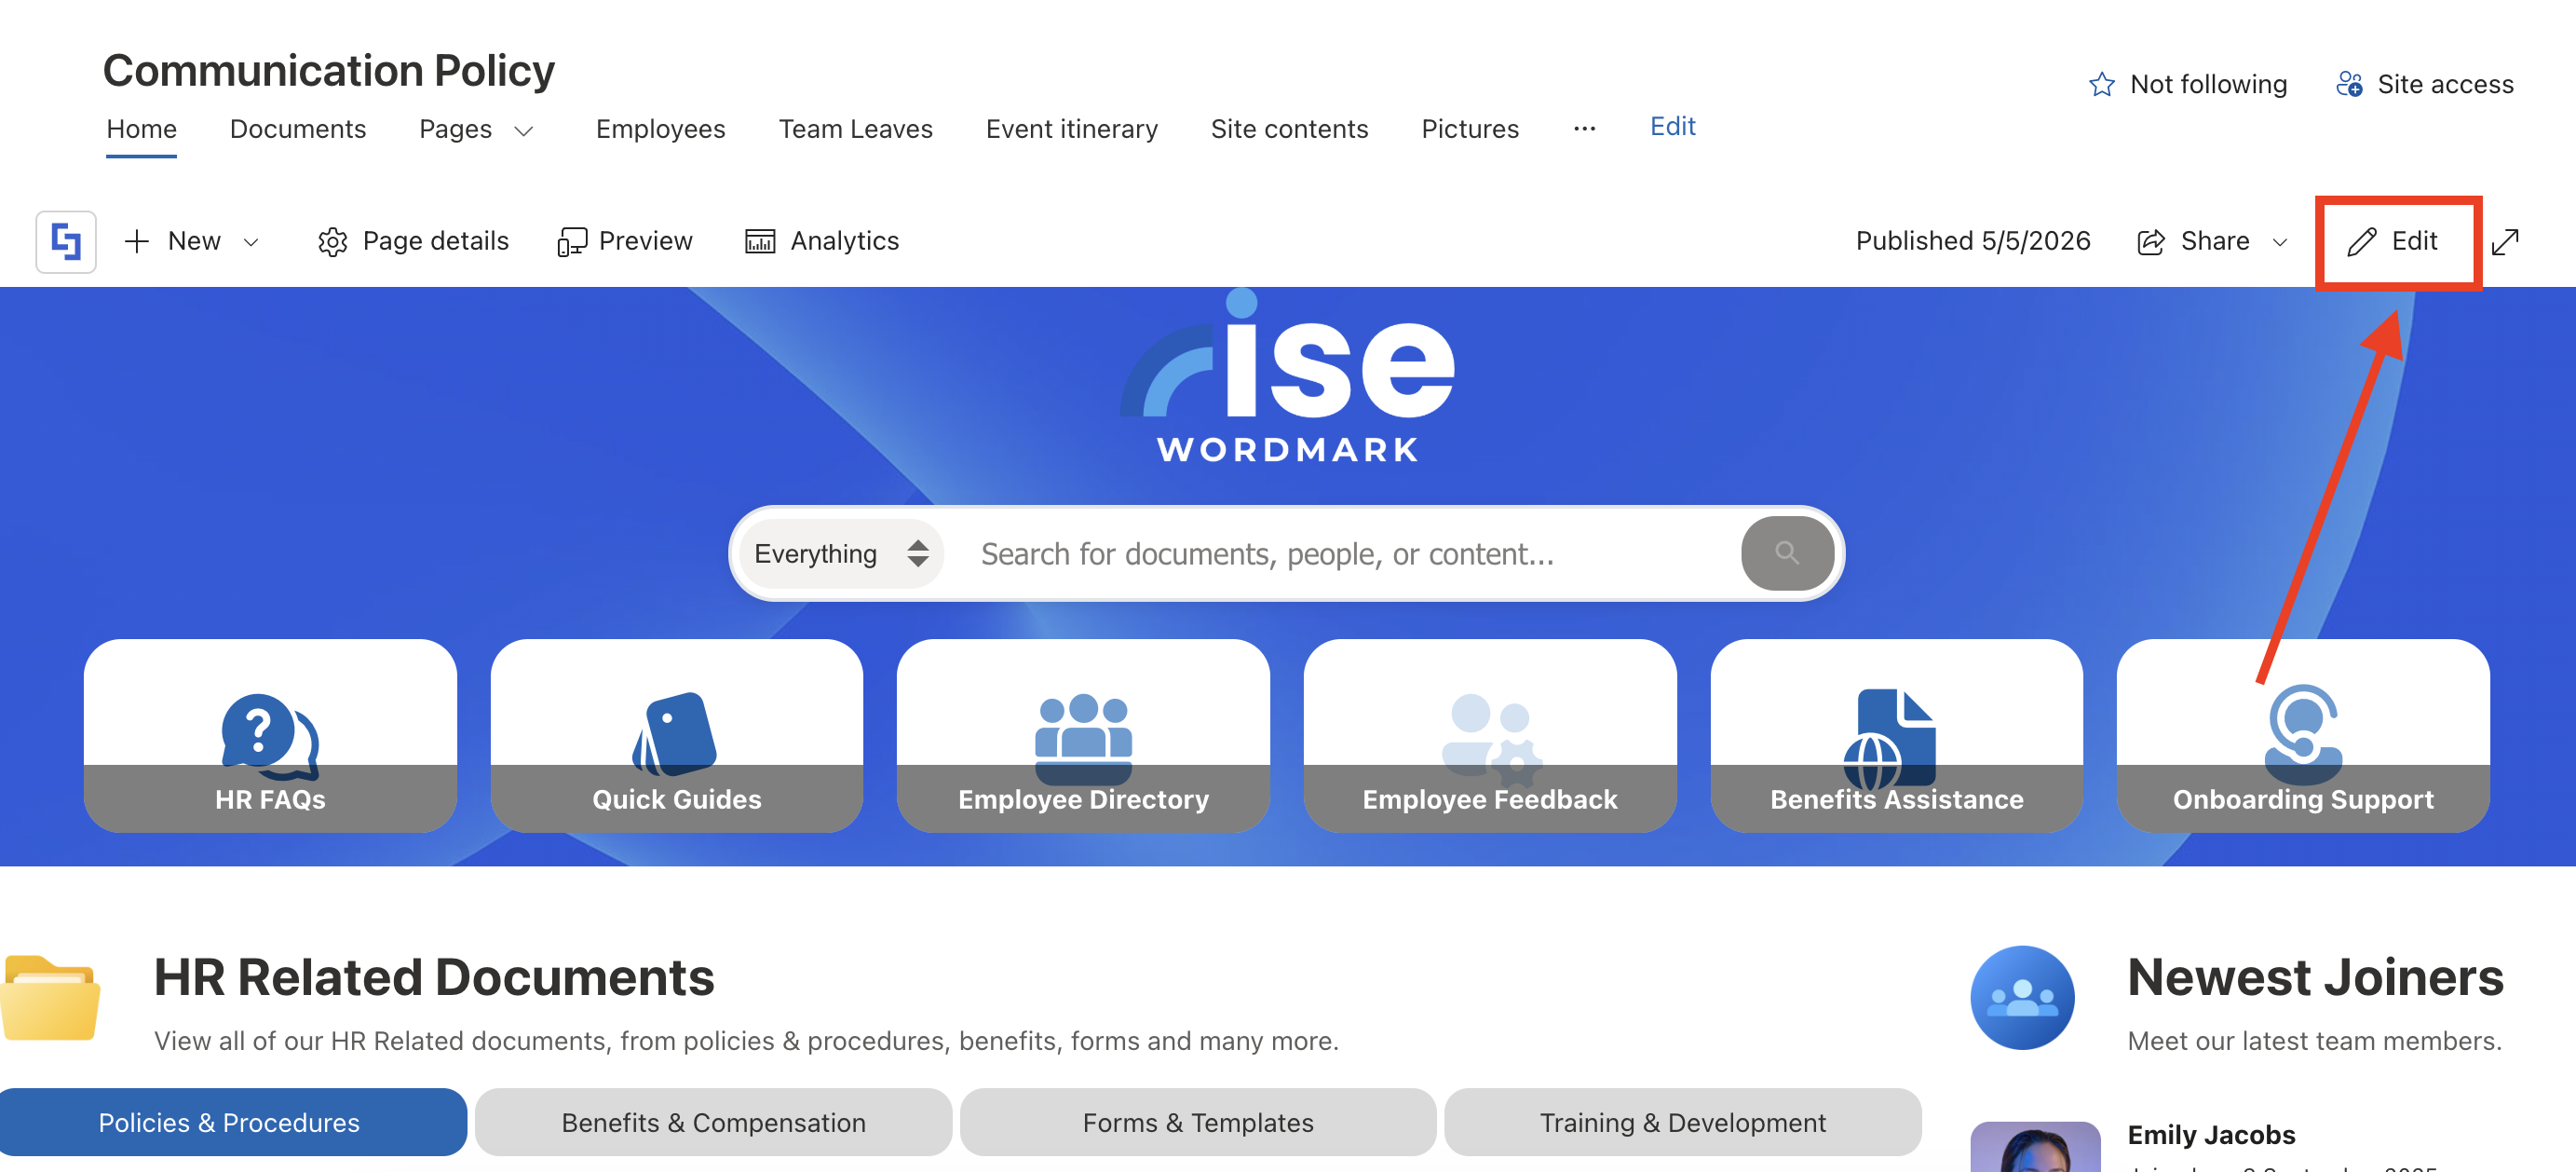
Go to the SharePoint page you want to use and click Edit:
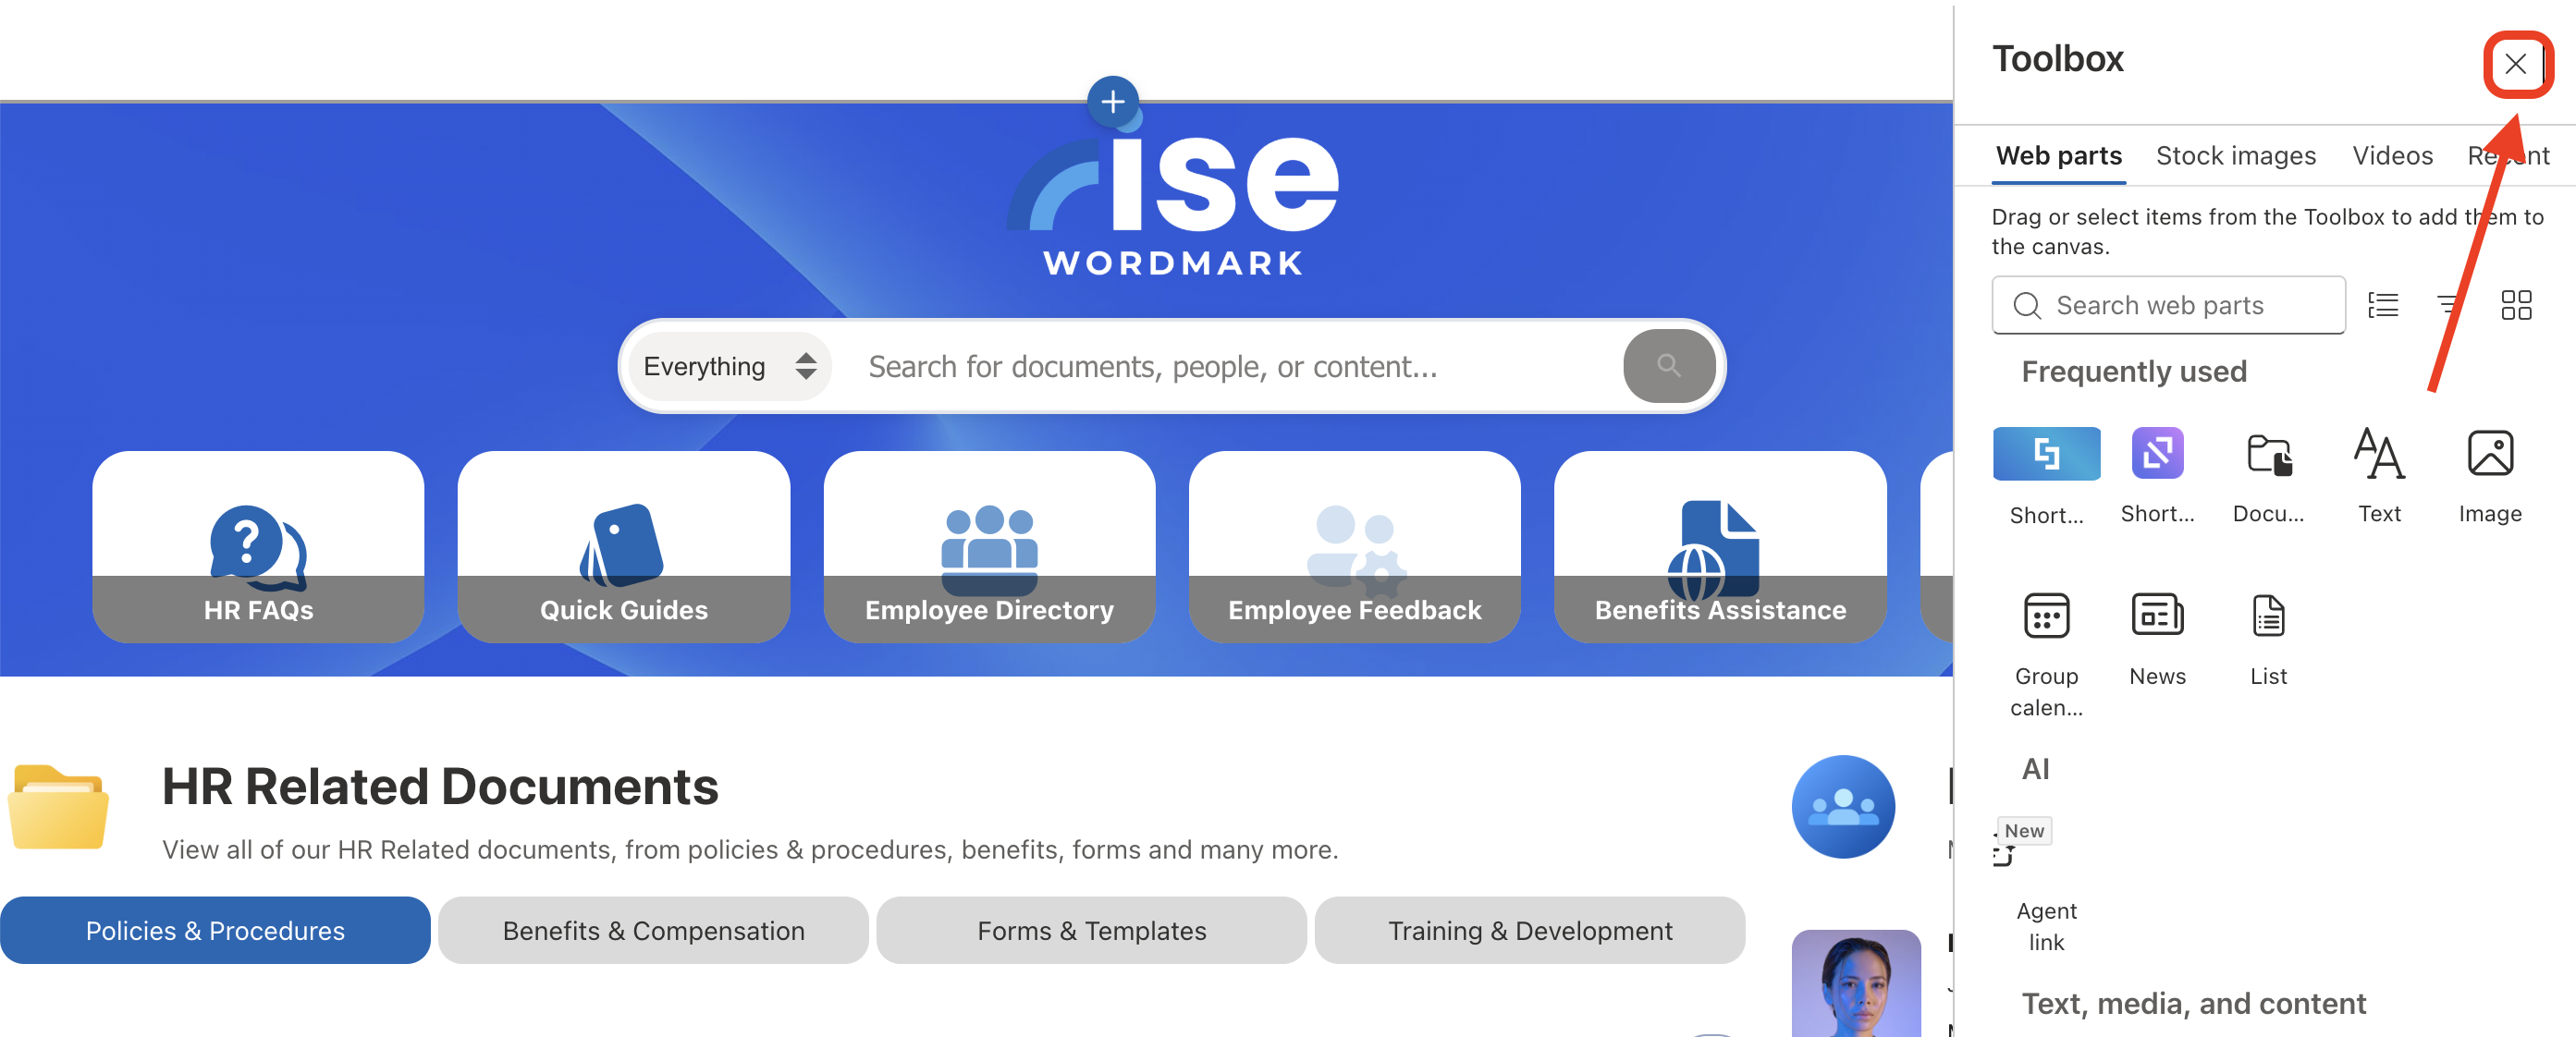
Close the Toolbox:
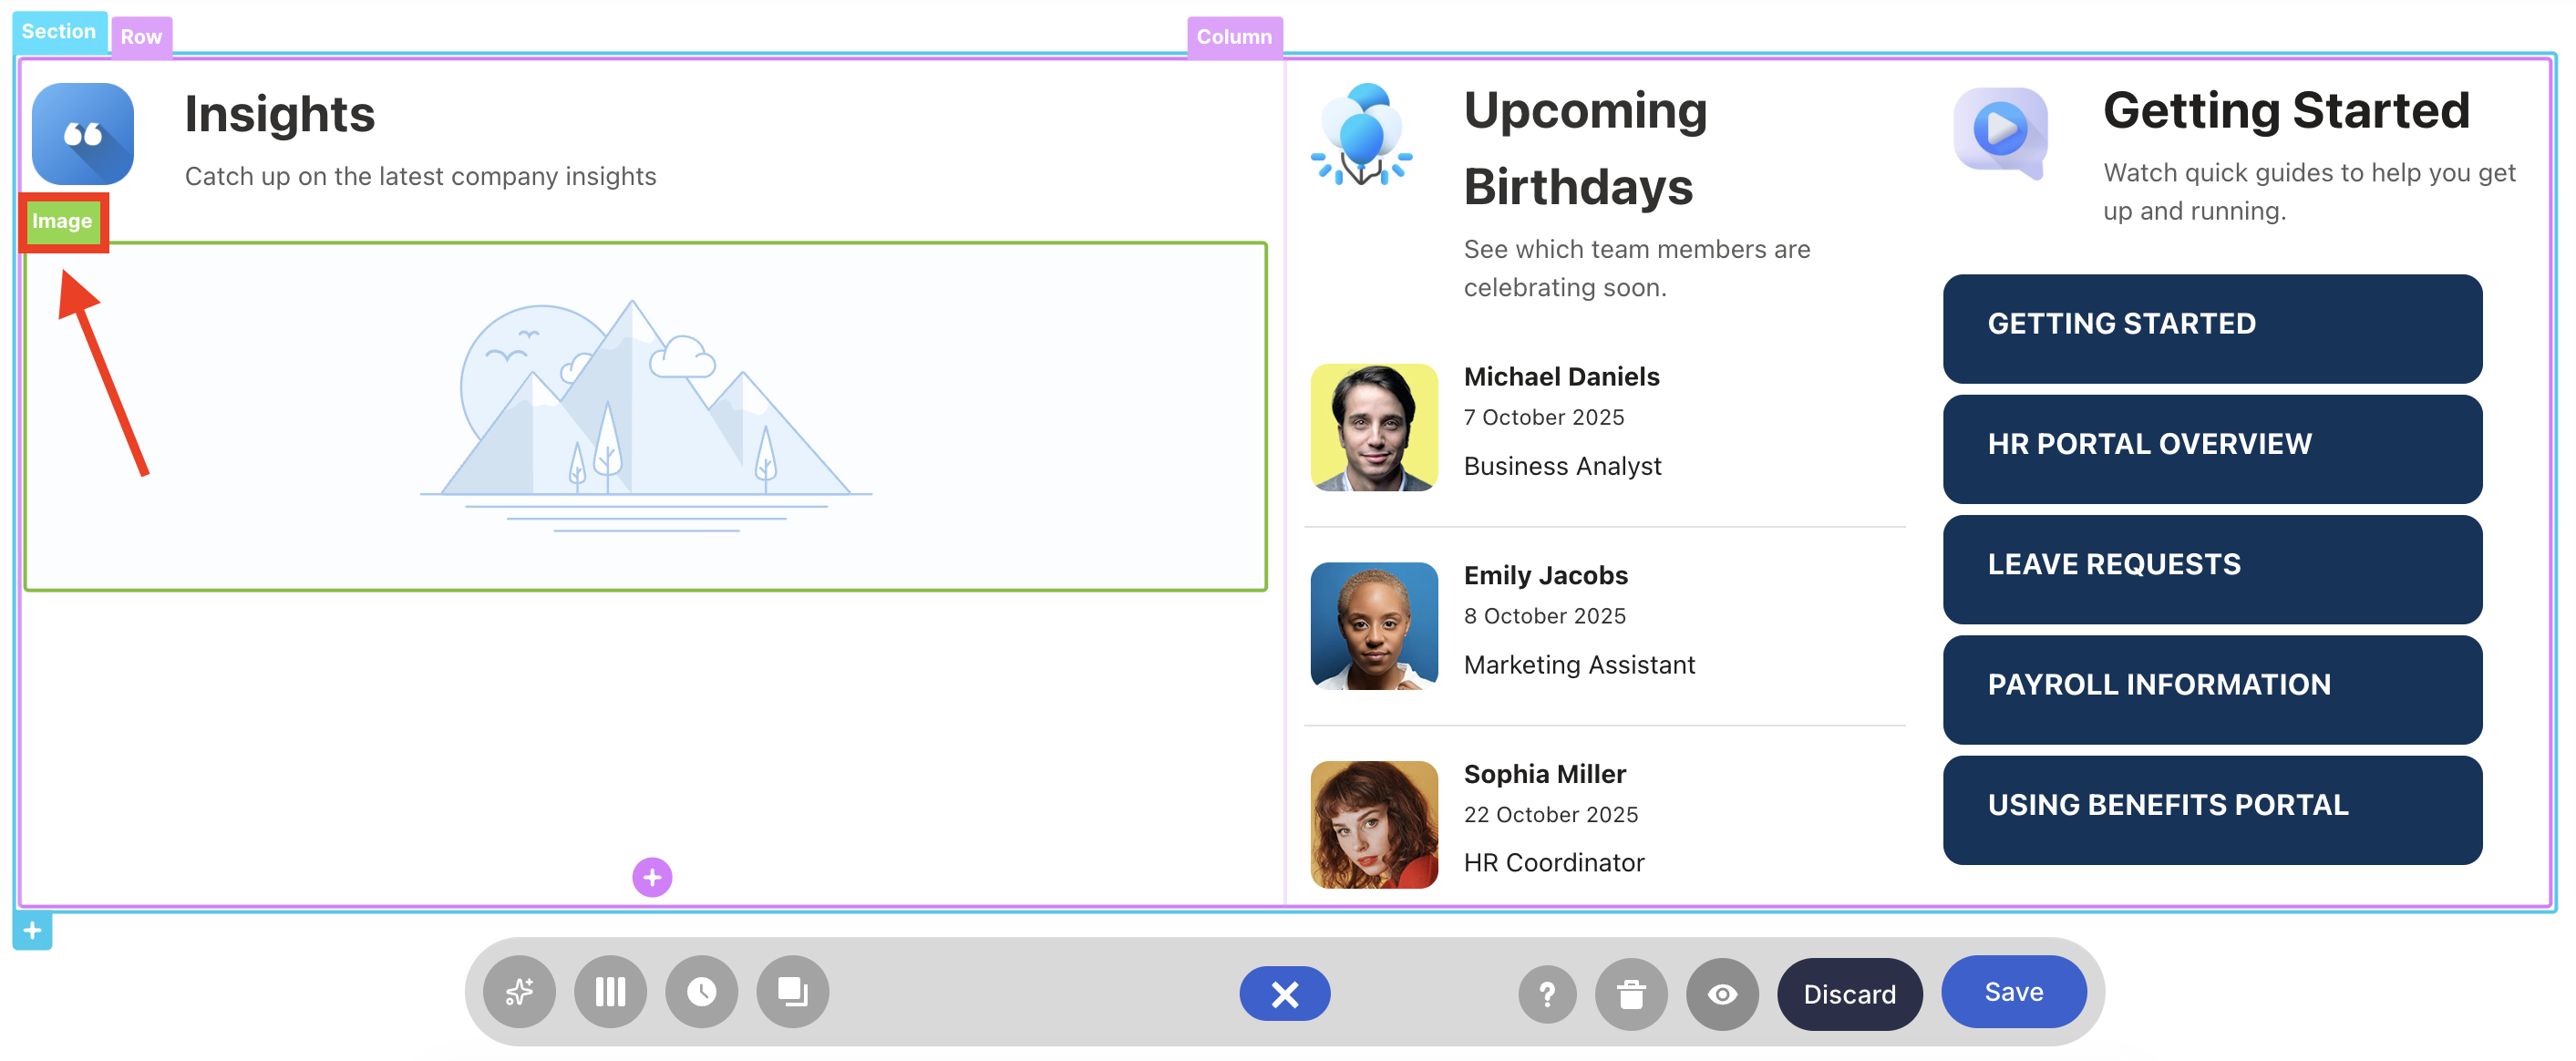
Select the ShortPoint web part and click the Edit Properties icon:

Step 2: Edit the Design Element
NOTEYou can use any Design Element you want. For best results, we recommend using Design Elements that allow image display (Image, Slideshow, Image Caption, etc.)
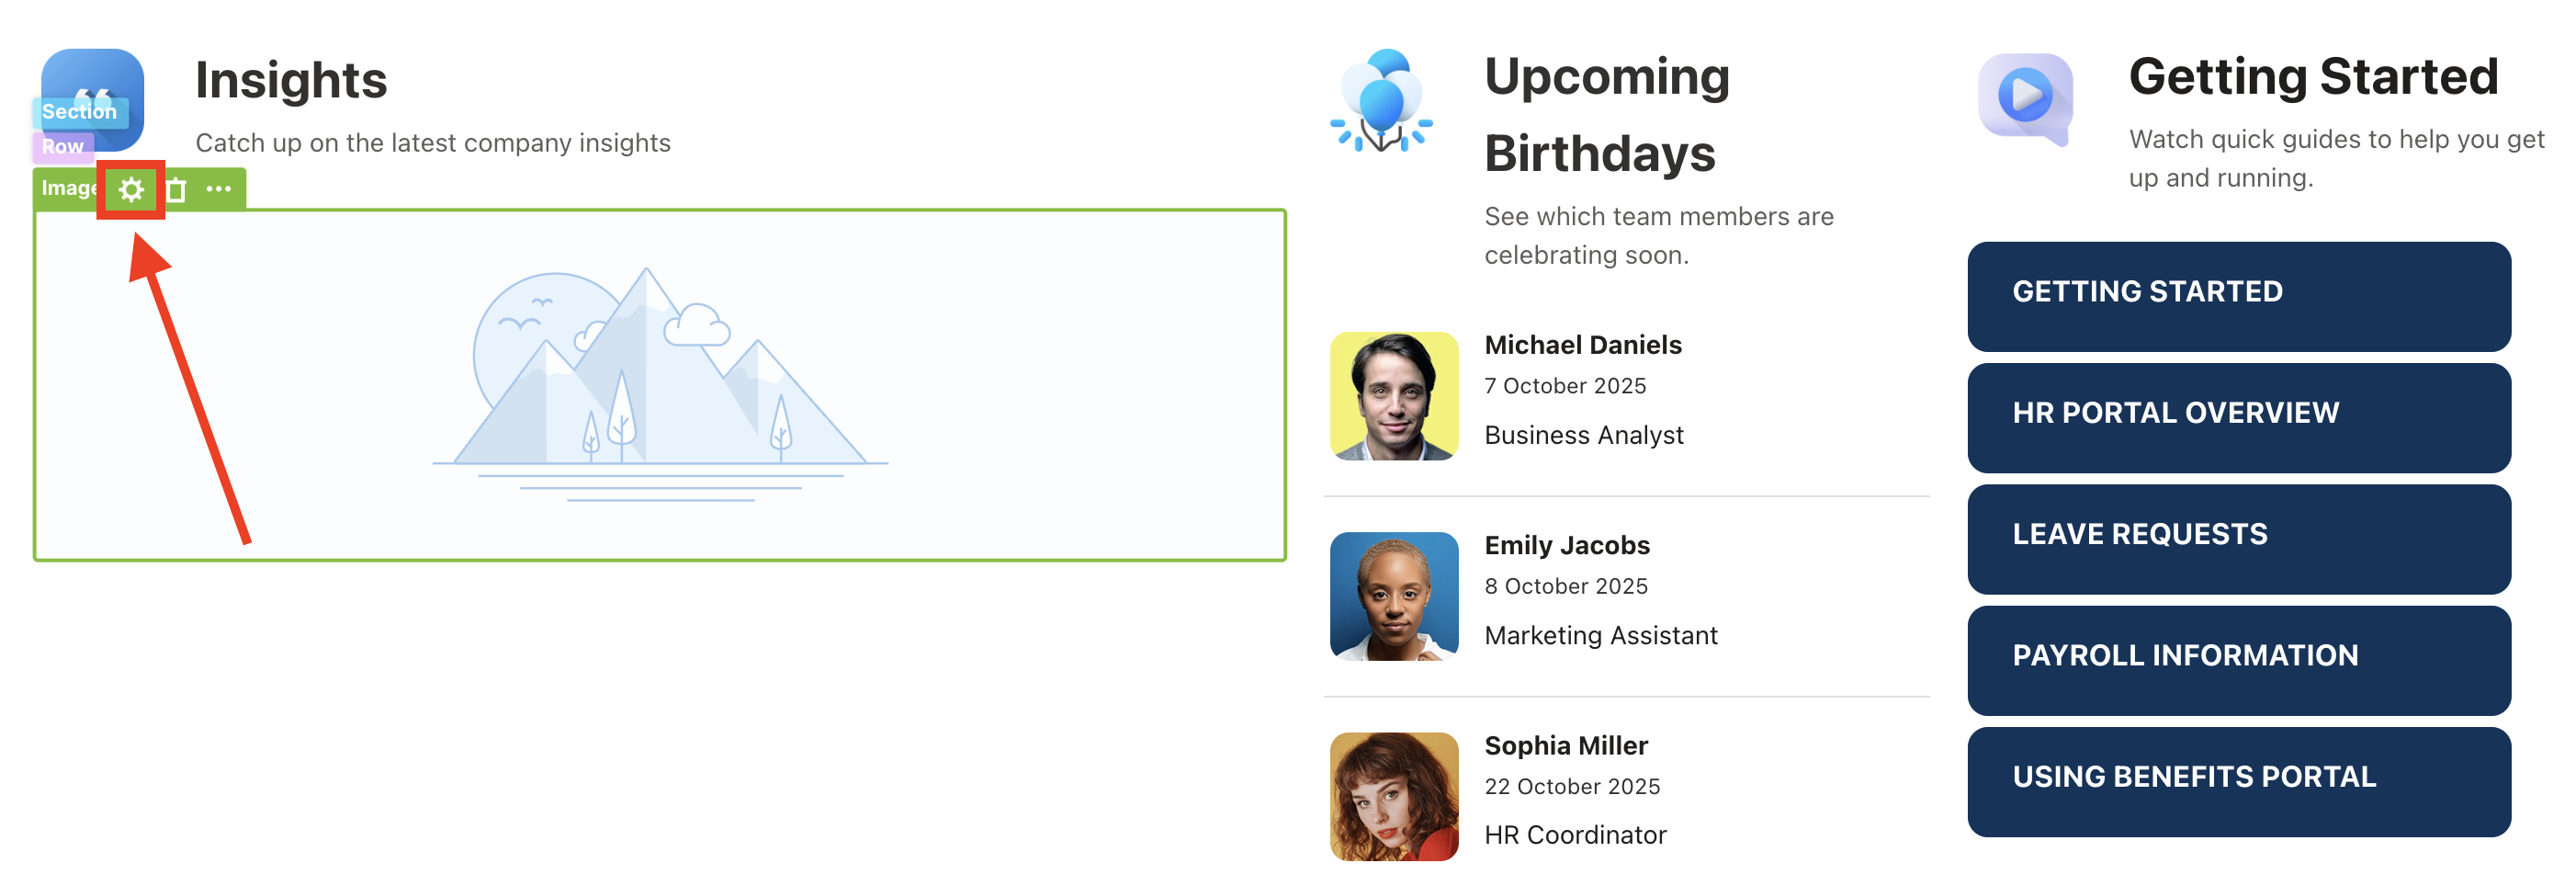
Click the EasyPass tag of the Design Element you’ll use:
Select the cogwheel icon:
Step 3: Open the Connect Window
Go to the Connect tab:
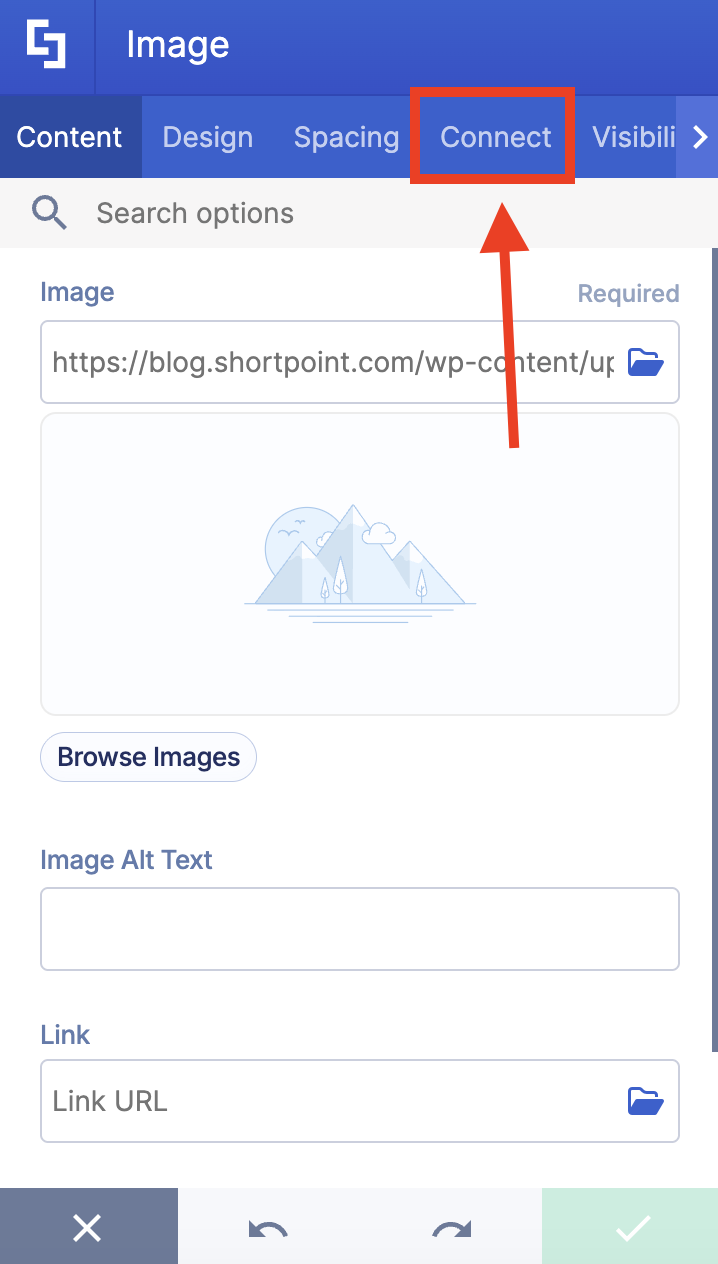
Click Configure to open the connect window:
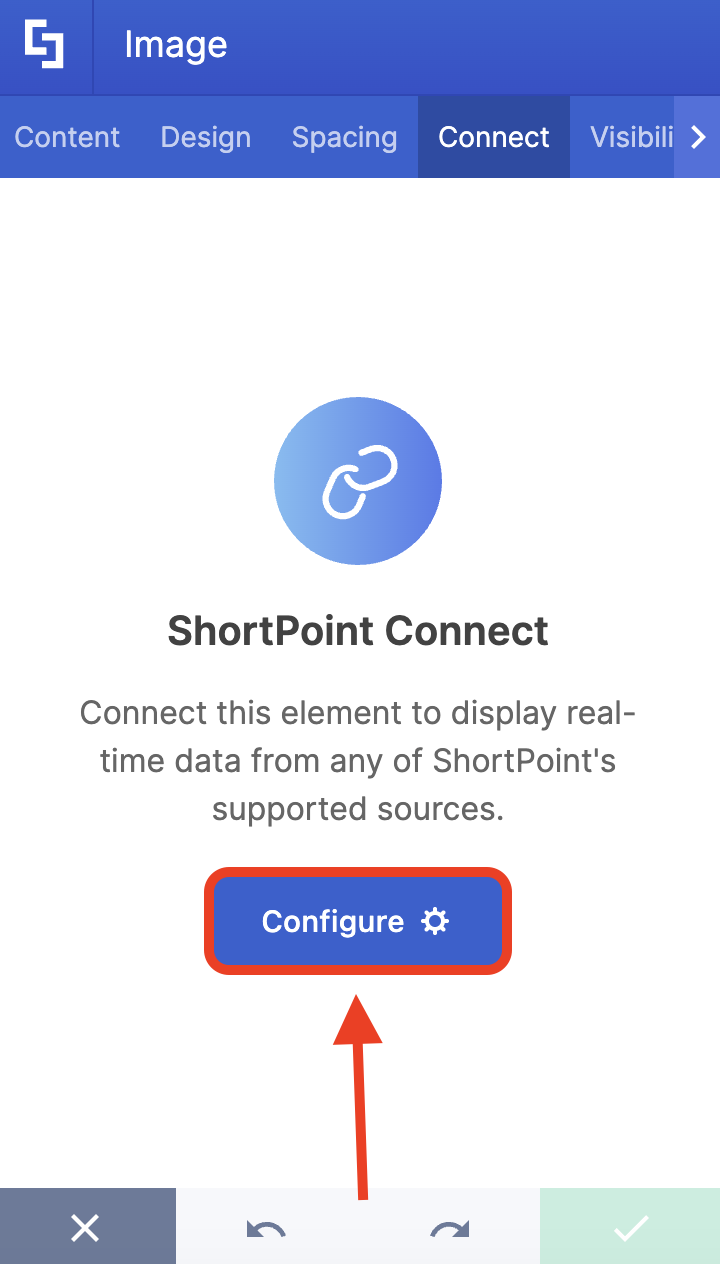
Step 4: Connect to Microsoft Graph API
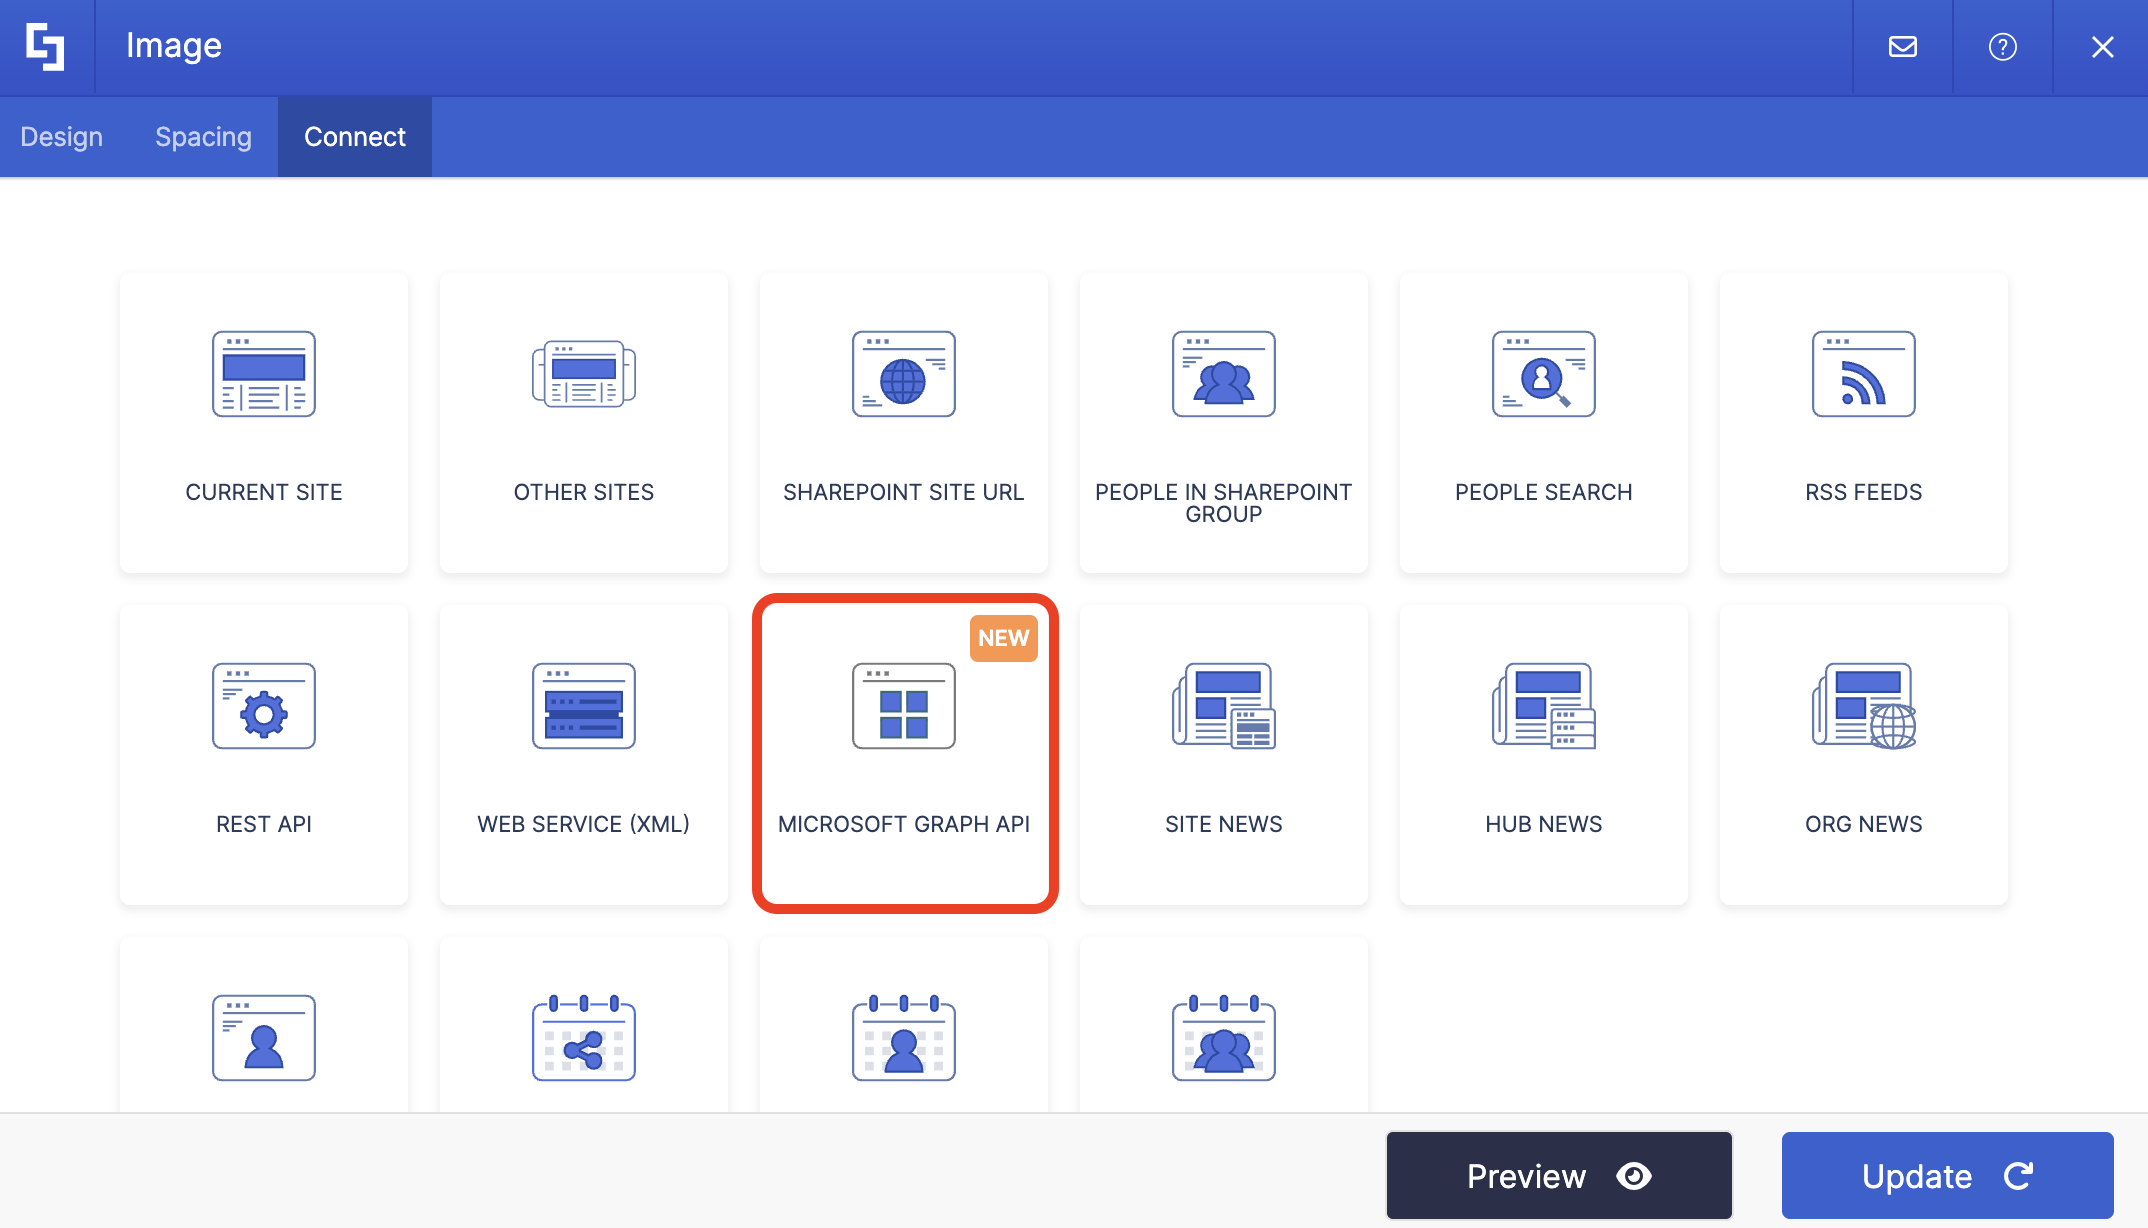
Select Microsoft Graph API:
NOTEYou need to enable the Microsoft Graph API connection before using it. Learn more about it in How to Enable Microsoft Graph Integration for MS Graph API Connections.
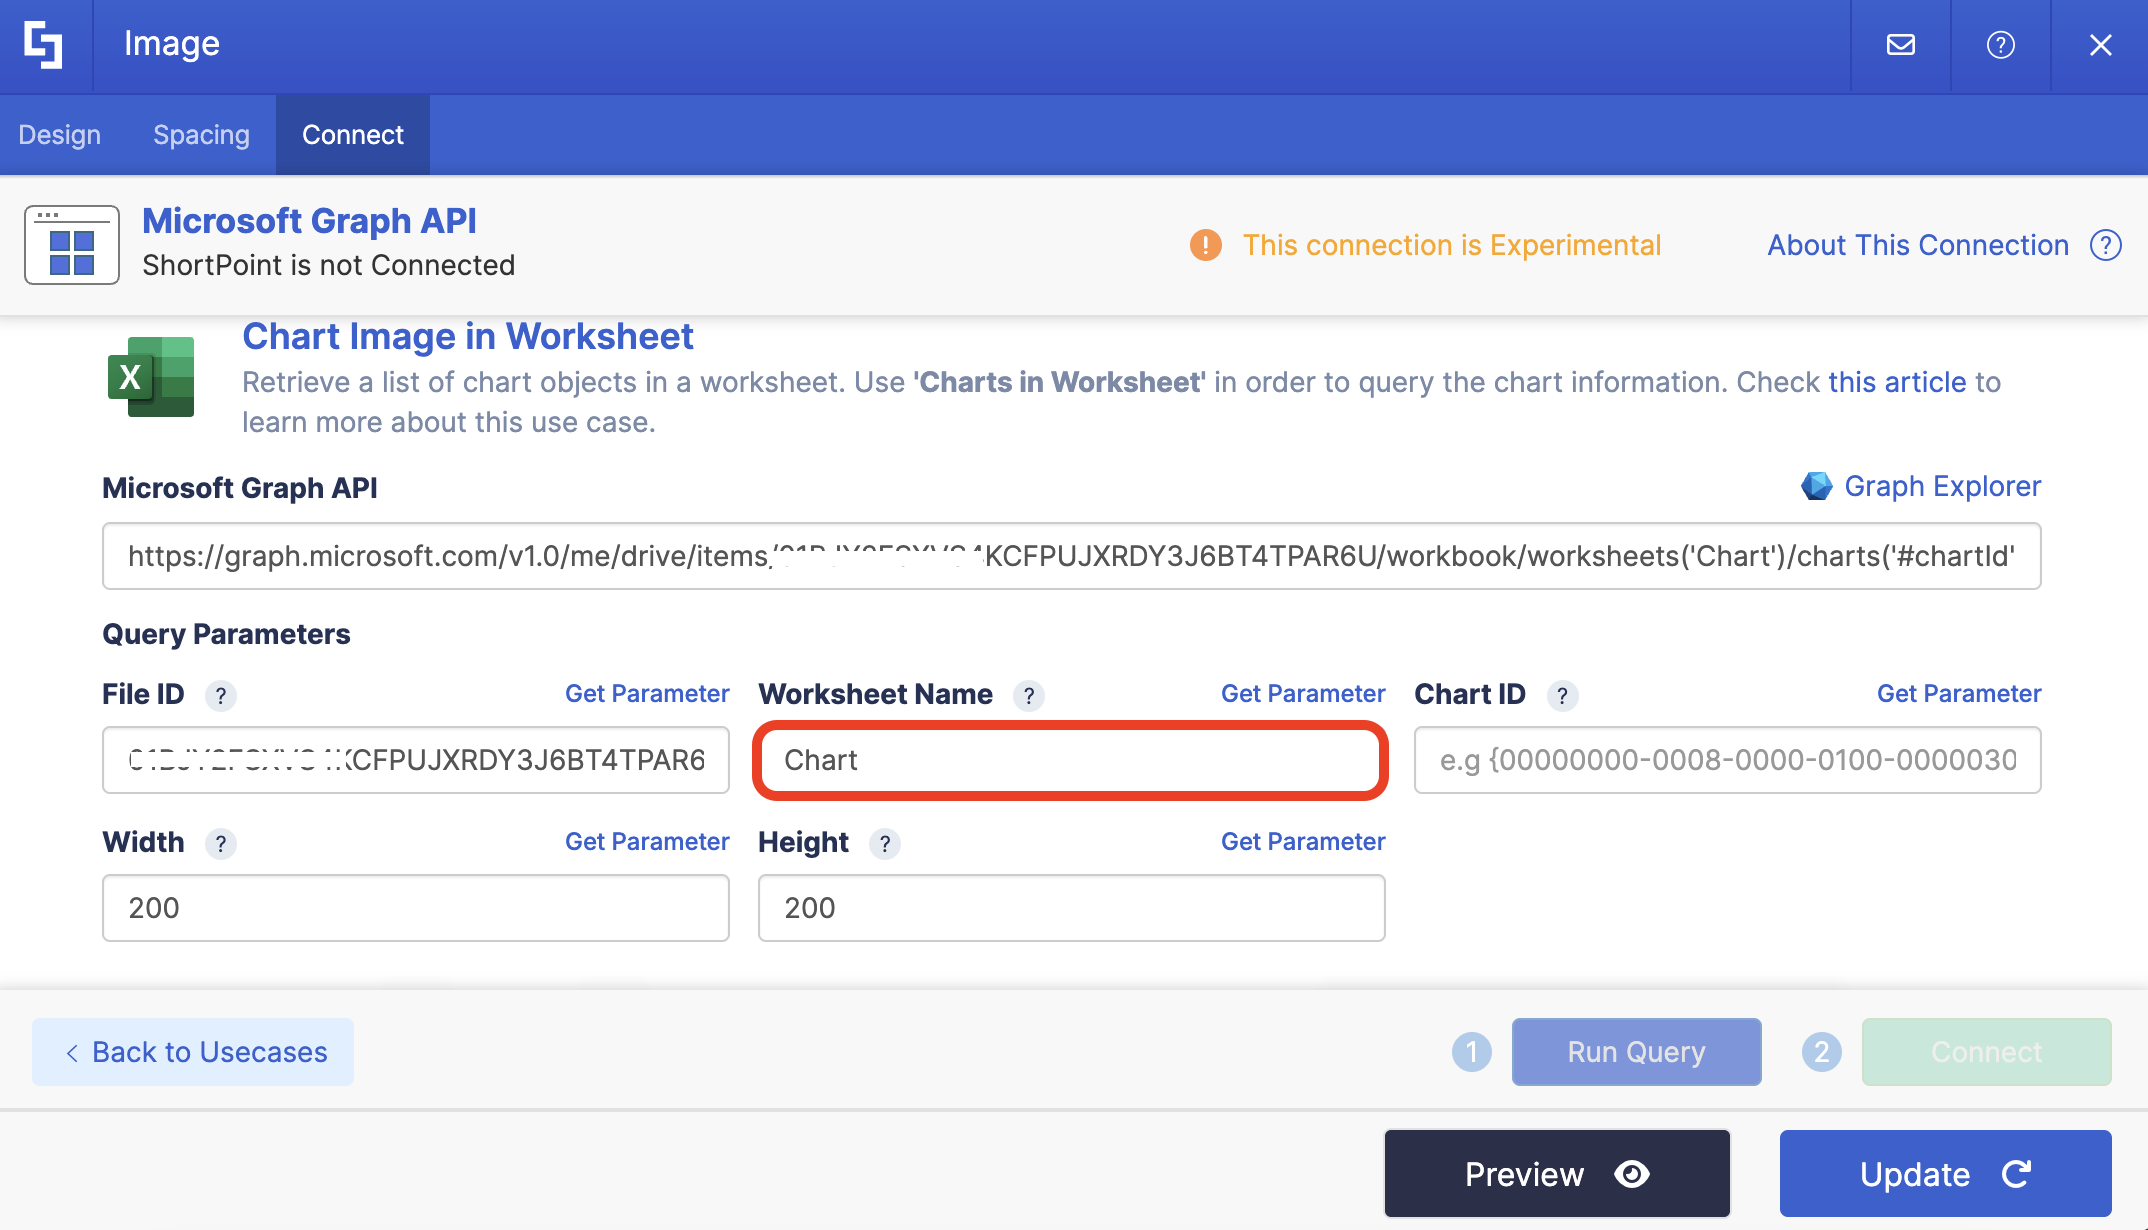
Step 5: Use the Chart Image in Worksheet Use Case
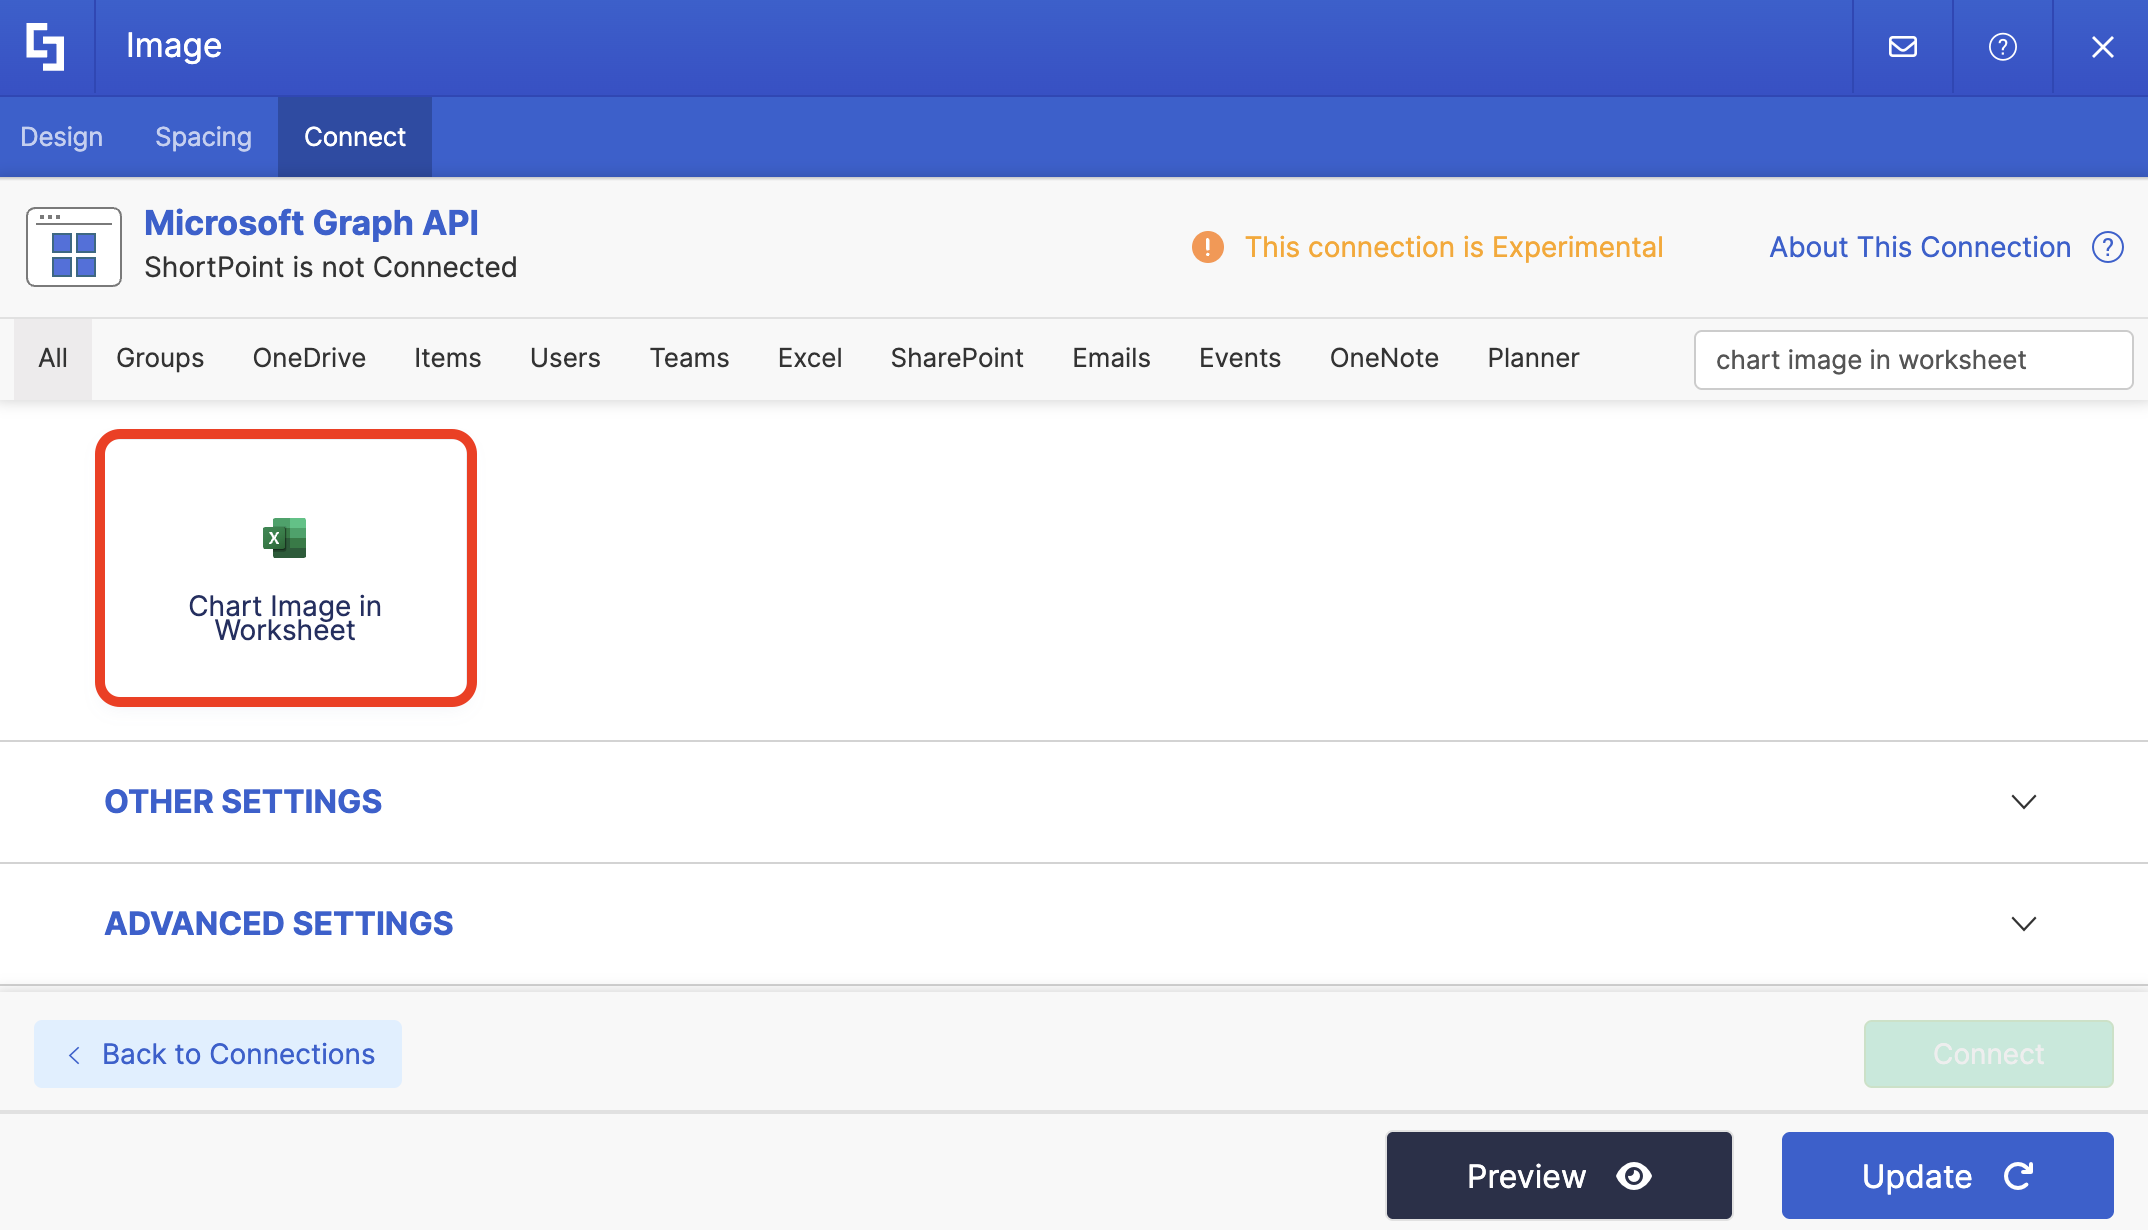
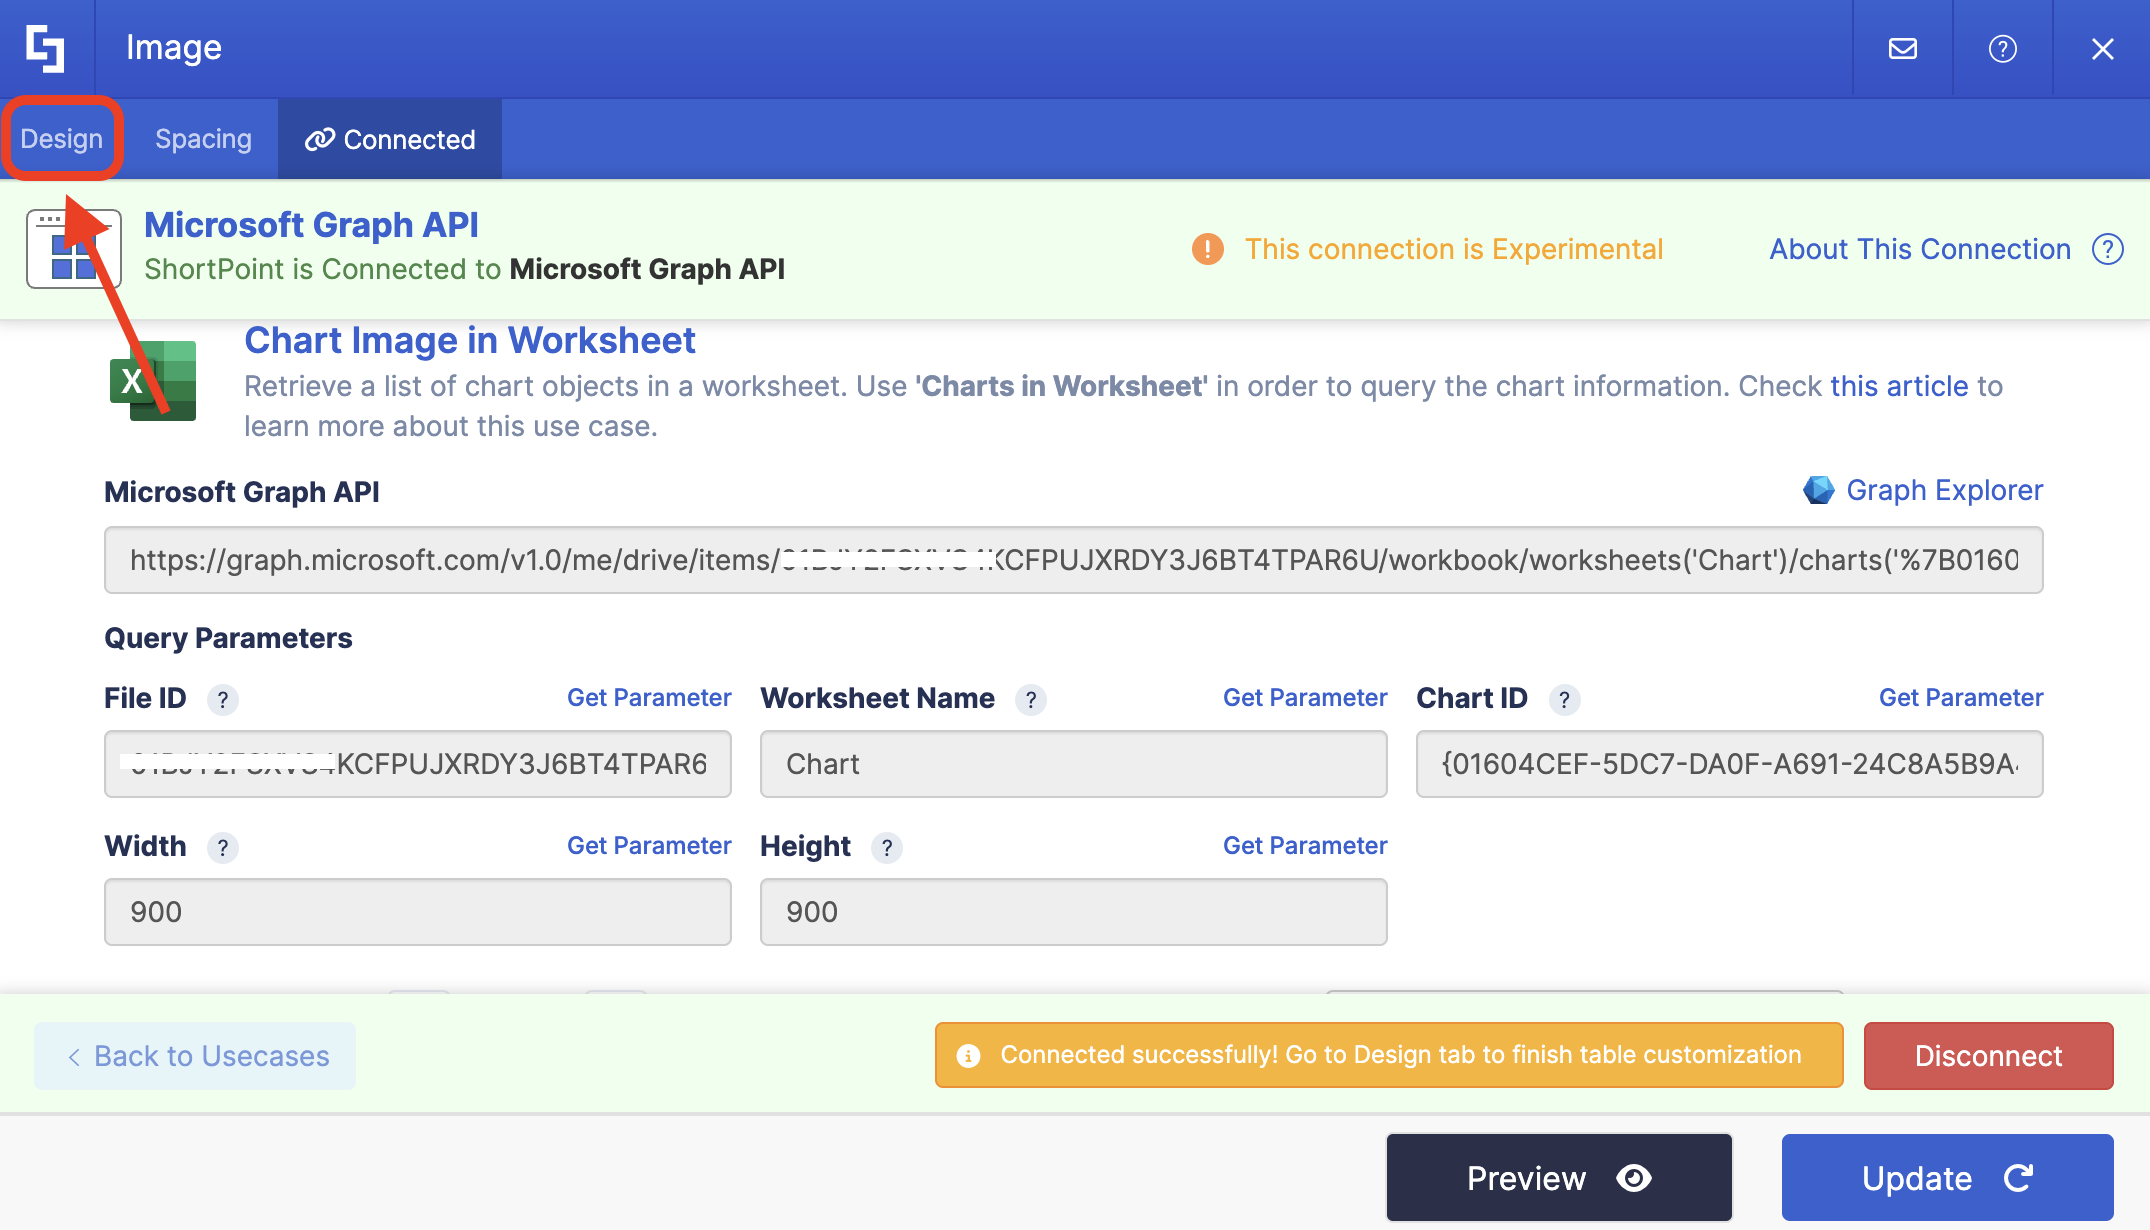
Search for Chart Image in Worksheet and select it:
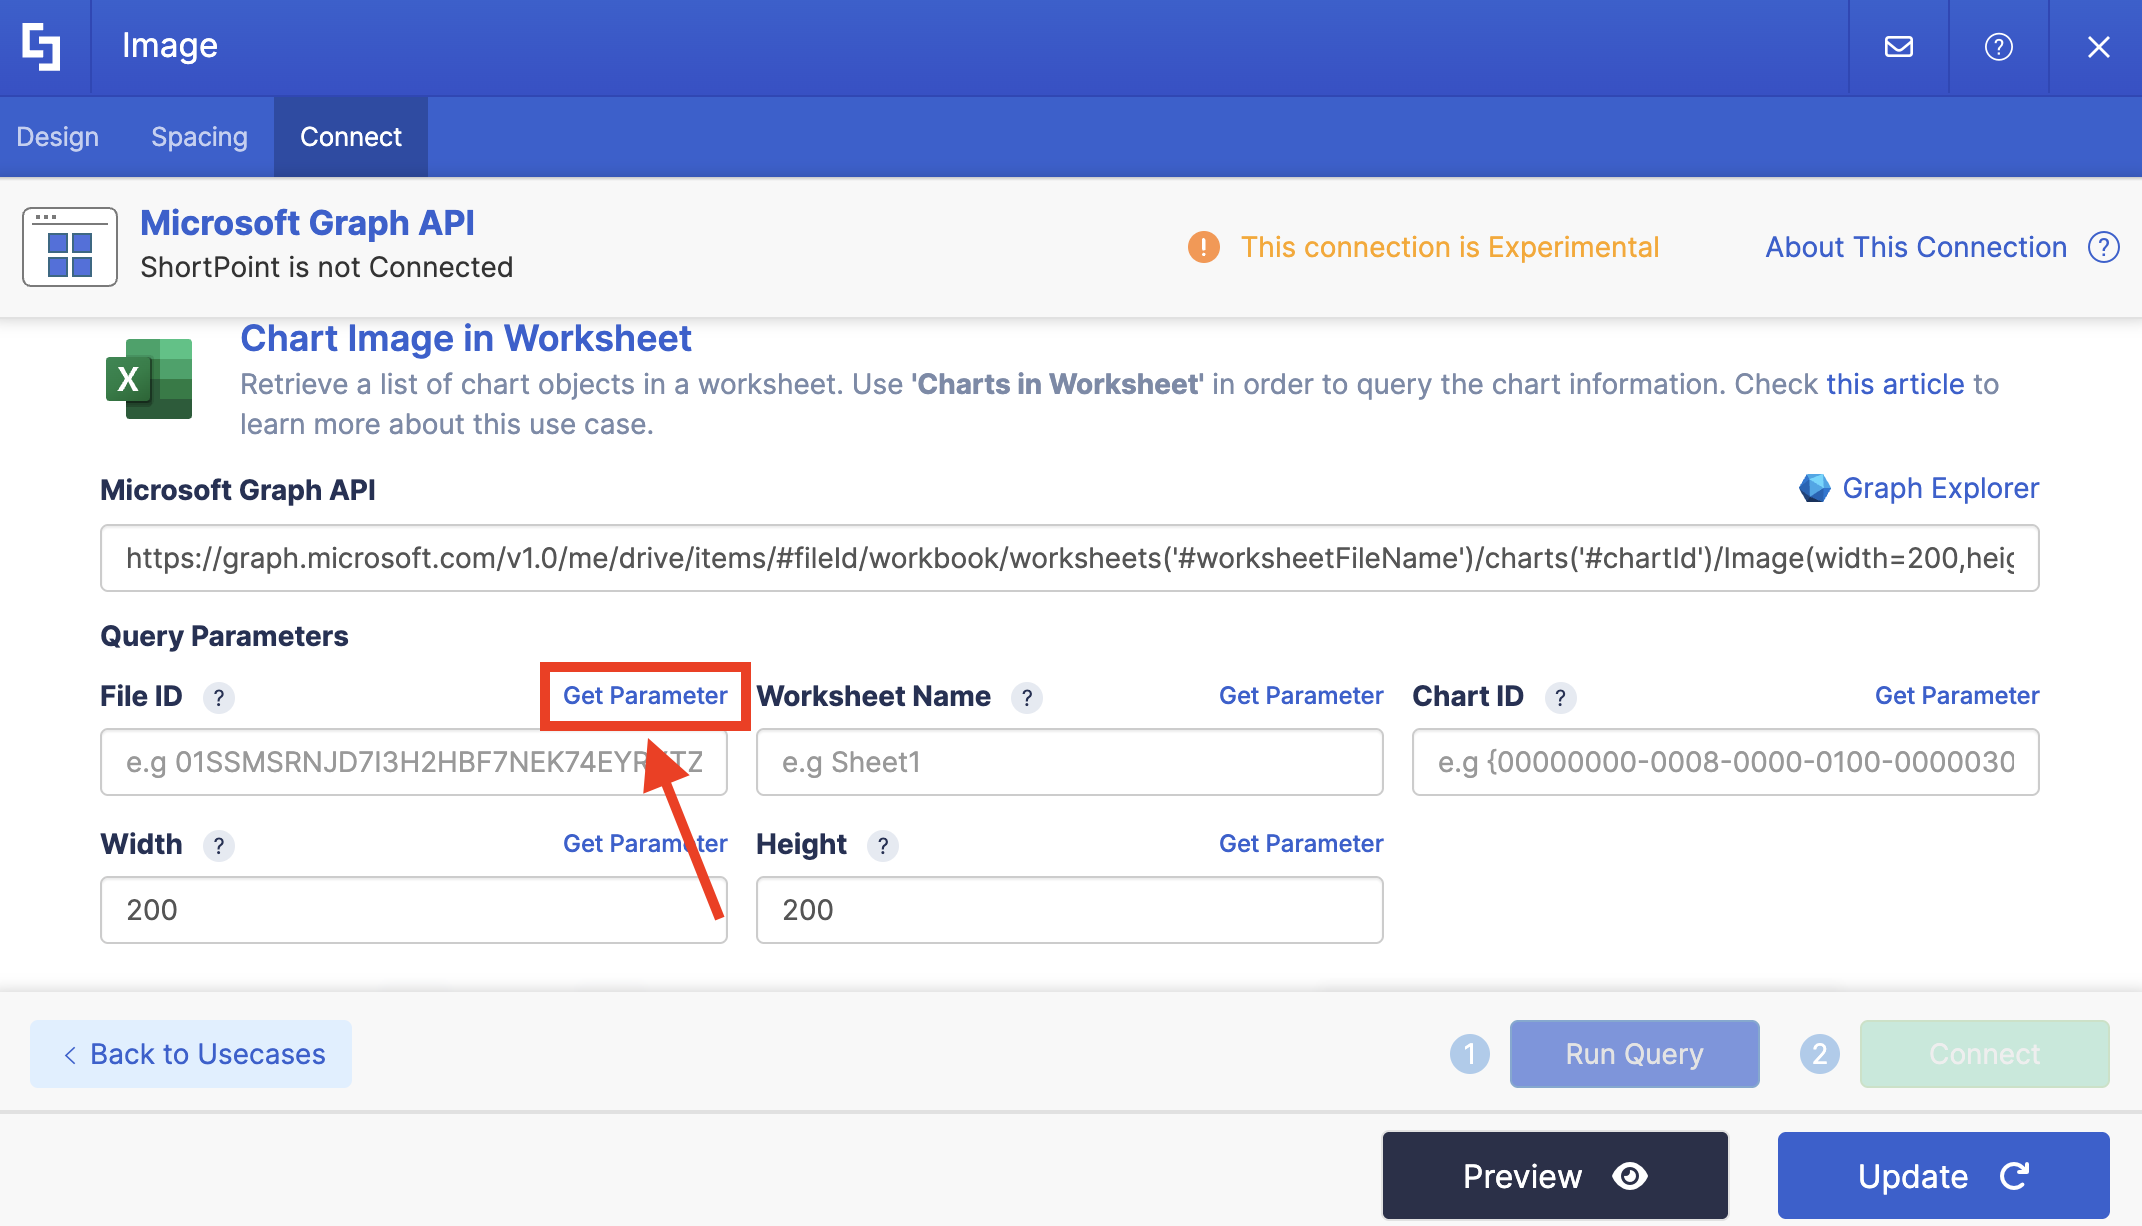
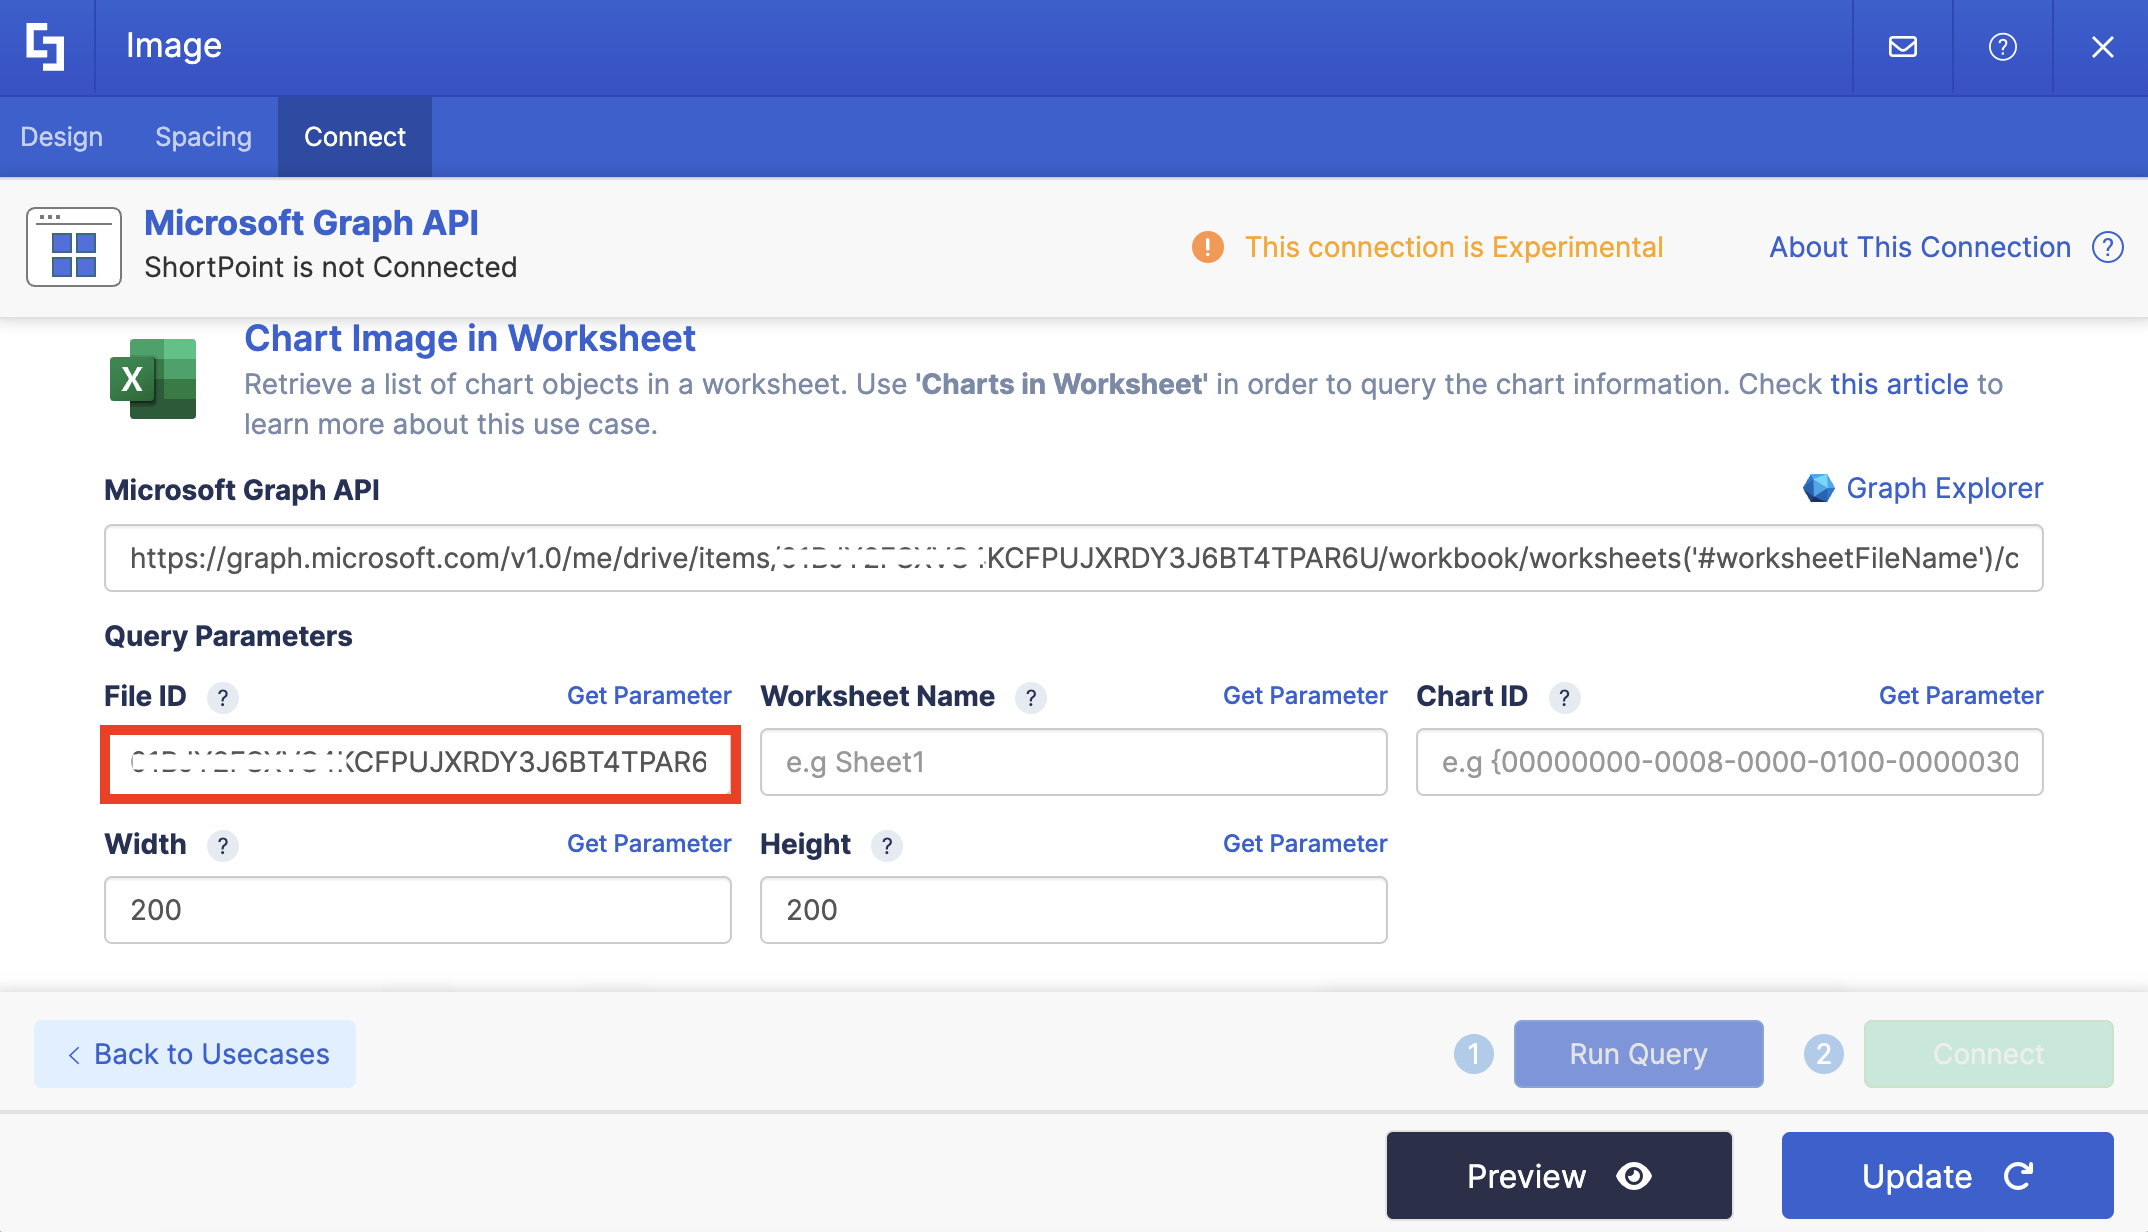
Step 6: Get File ID
Under Query Parameter, you will need to get certain details. Let's start with File ID, first. Click Get Parameter:
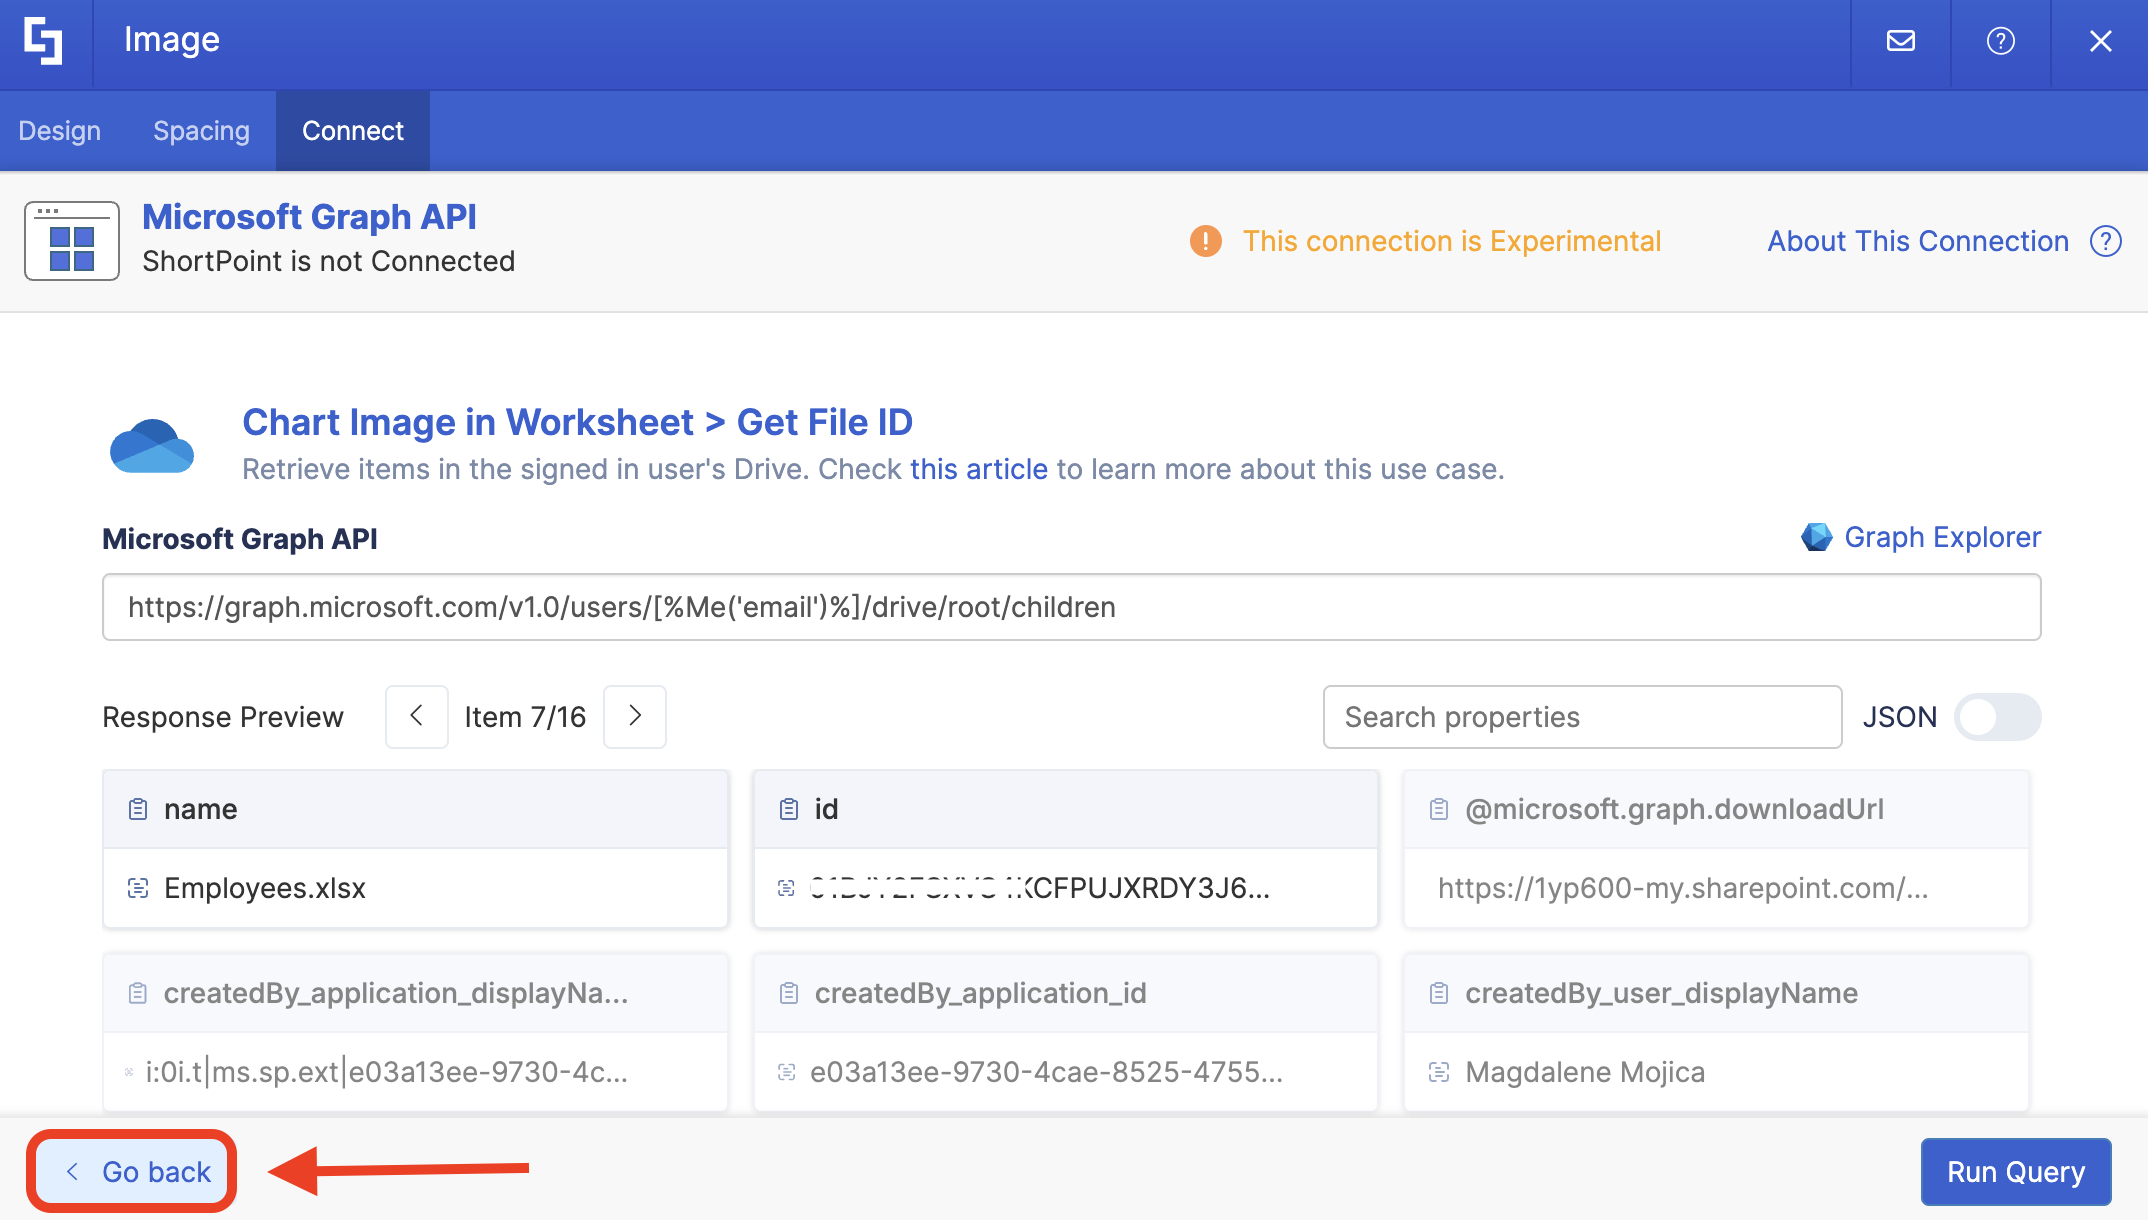
Look for the name of the file you want to use and copy its ID:
Click Go back:
Paste the copied ID in the field provided:
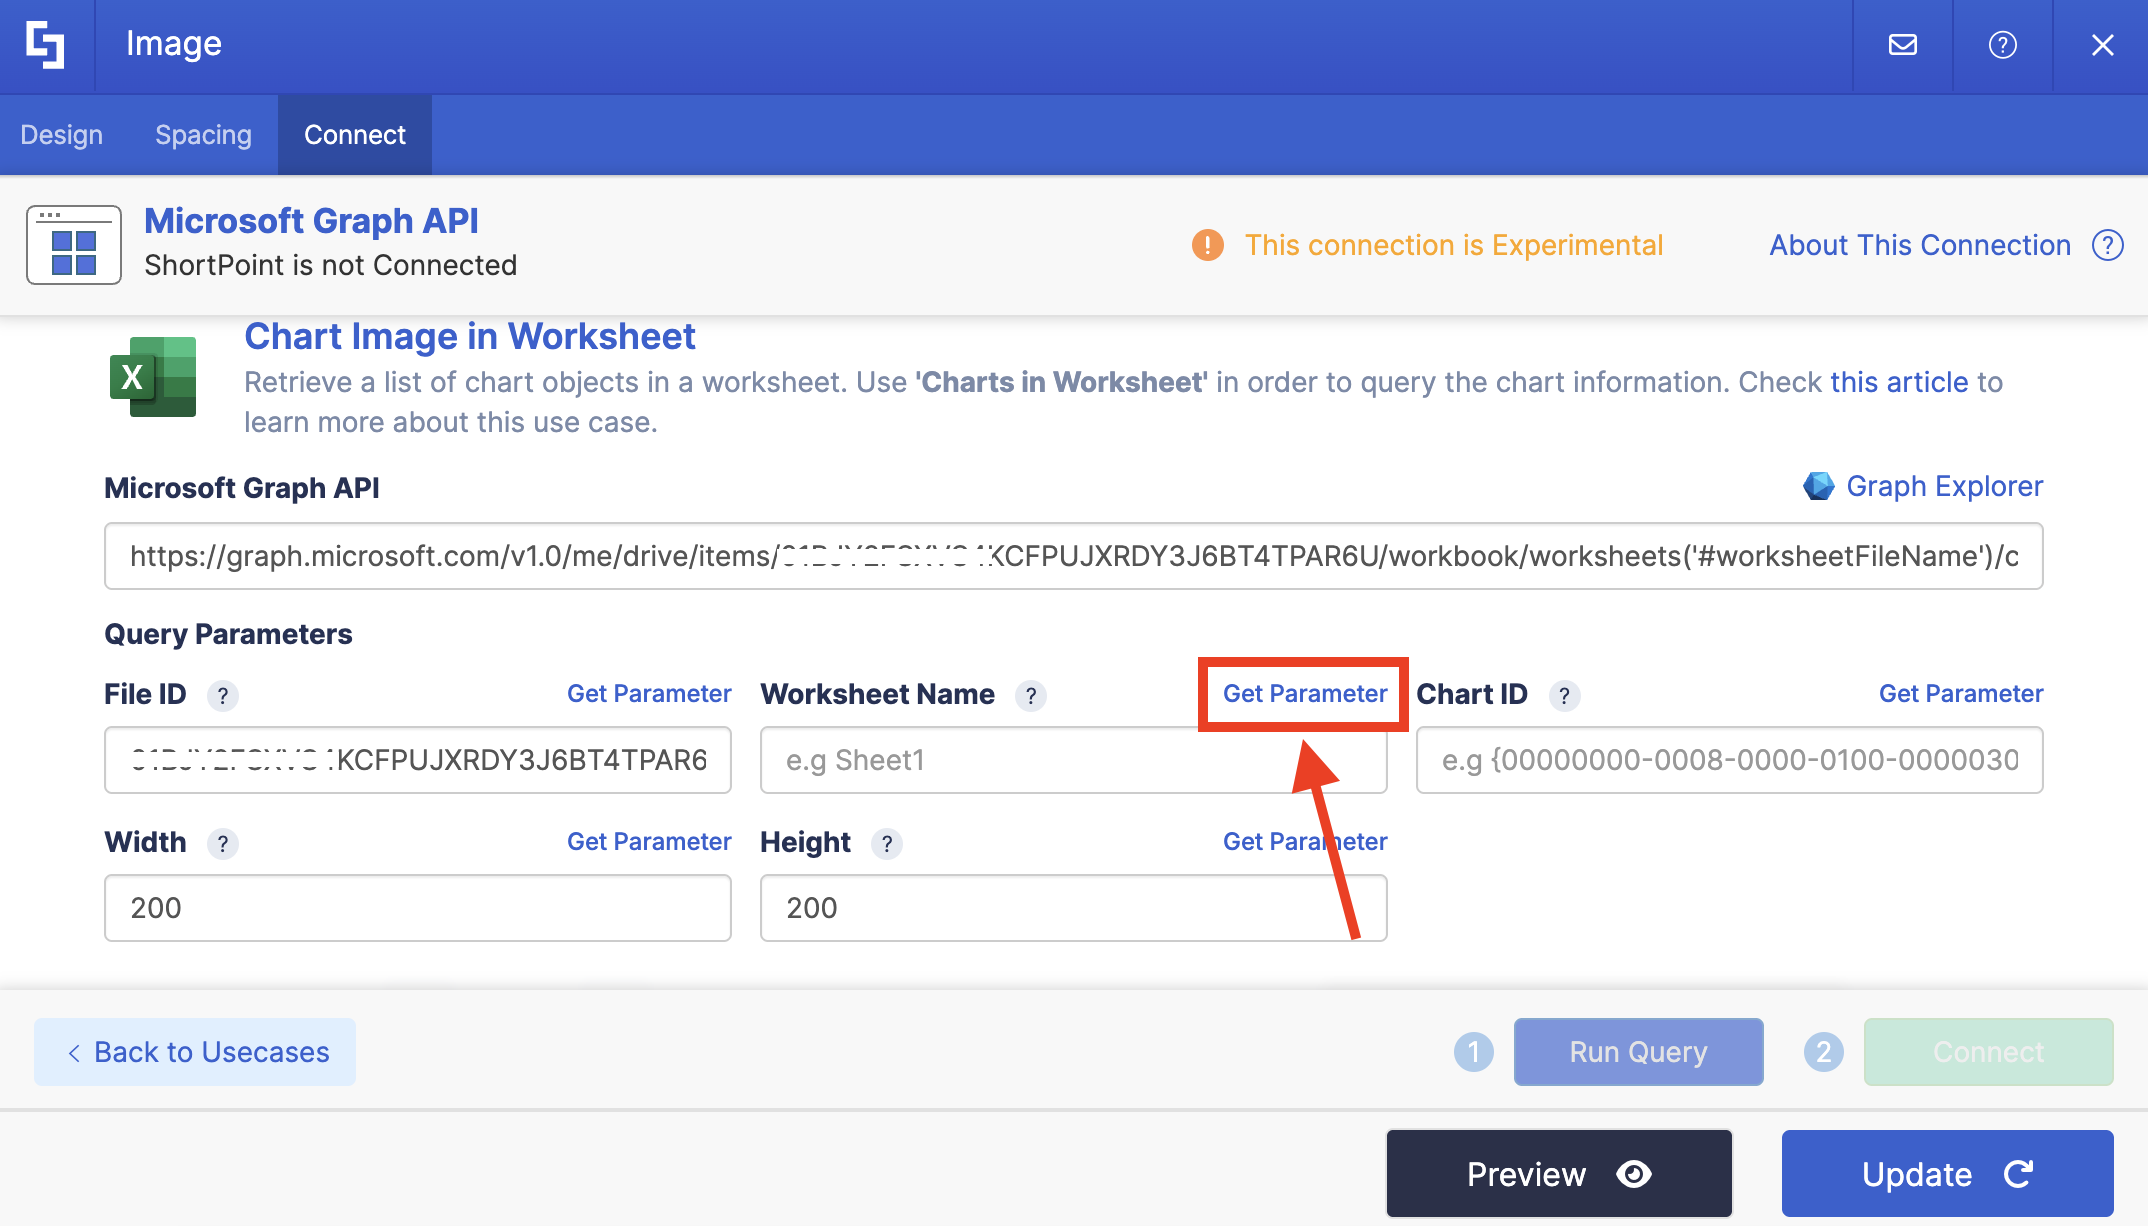
Step 7: Get Worksheet Name
Click Get Parameter next to Worksheet Name:
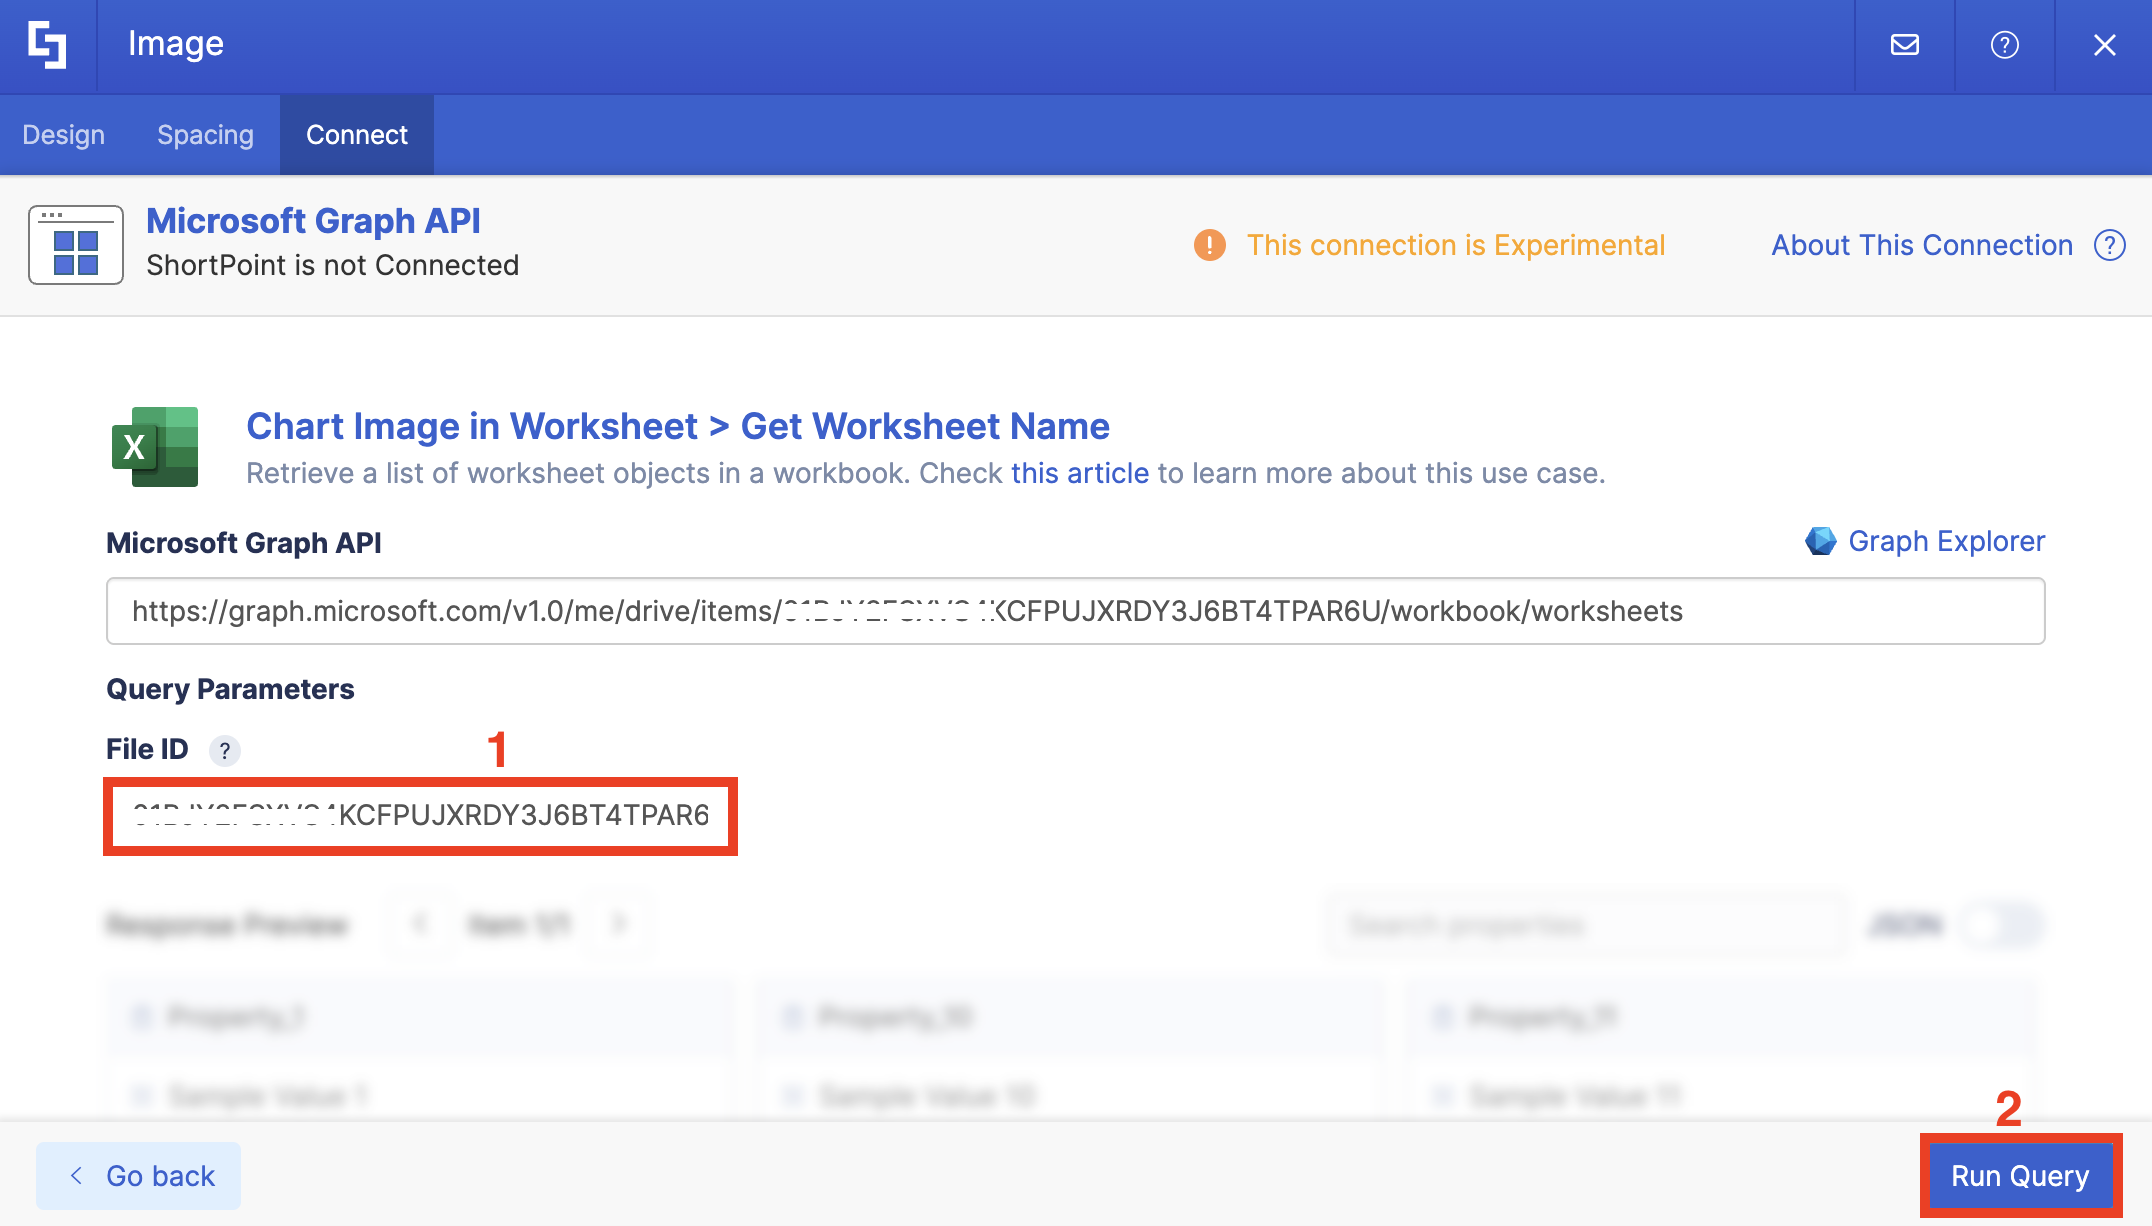
Paste the [1] File ID you copied and click [2] Run Query:
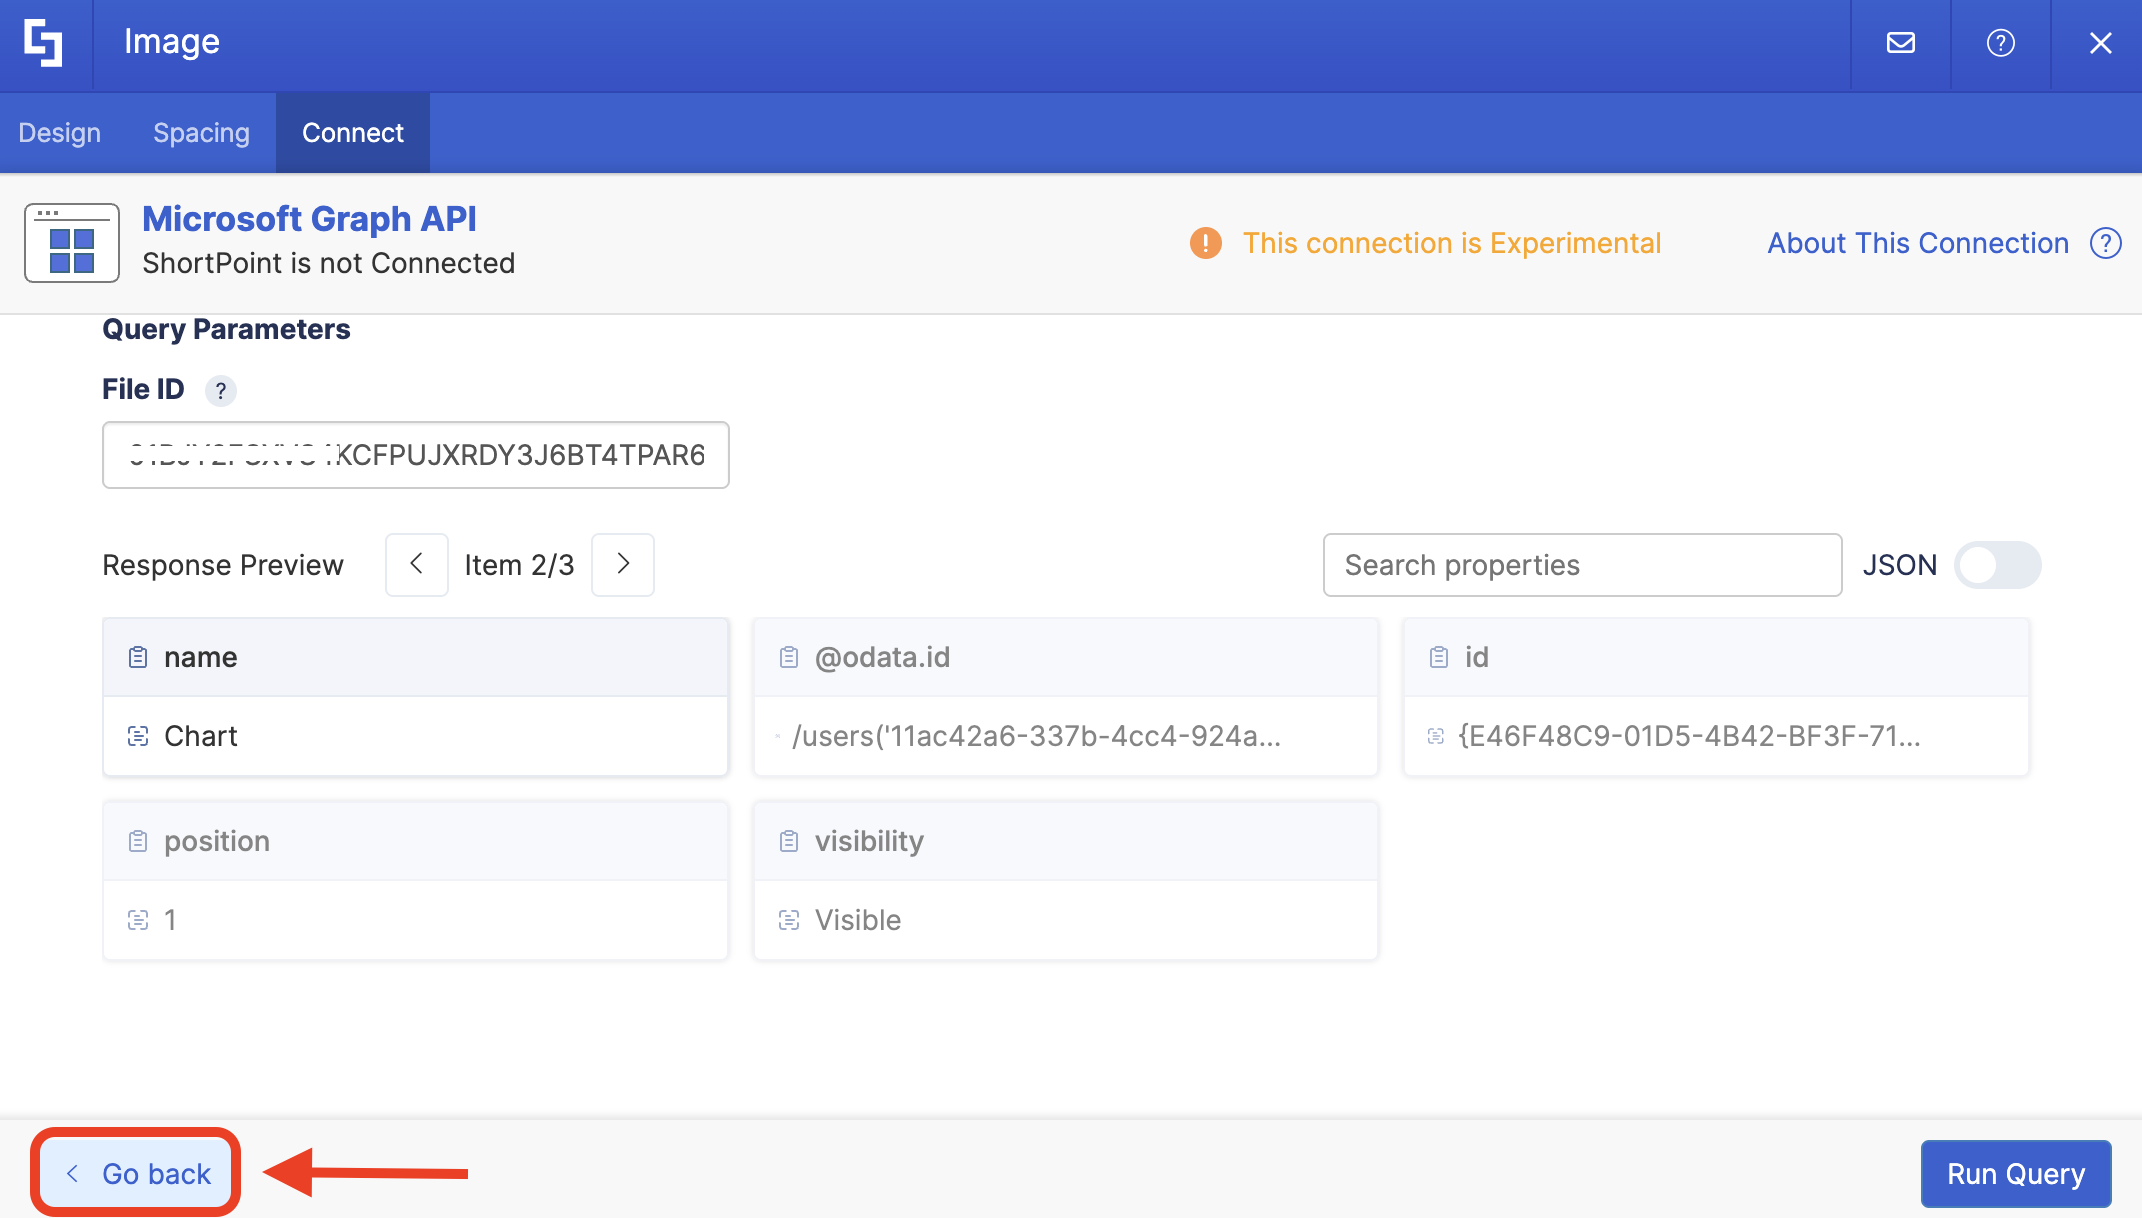
Look for the worksheet where your chart is located and take note of the name. In our case, our chart is in the 'Charts' sheet:
Click Go back:
Write the Worksheet Name in the field provided:
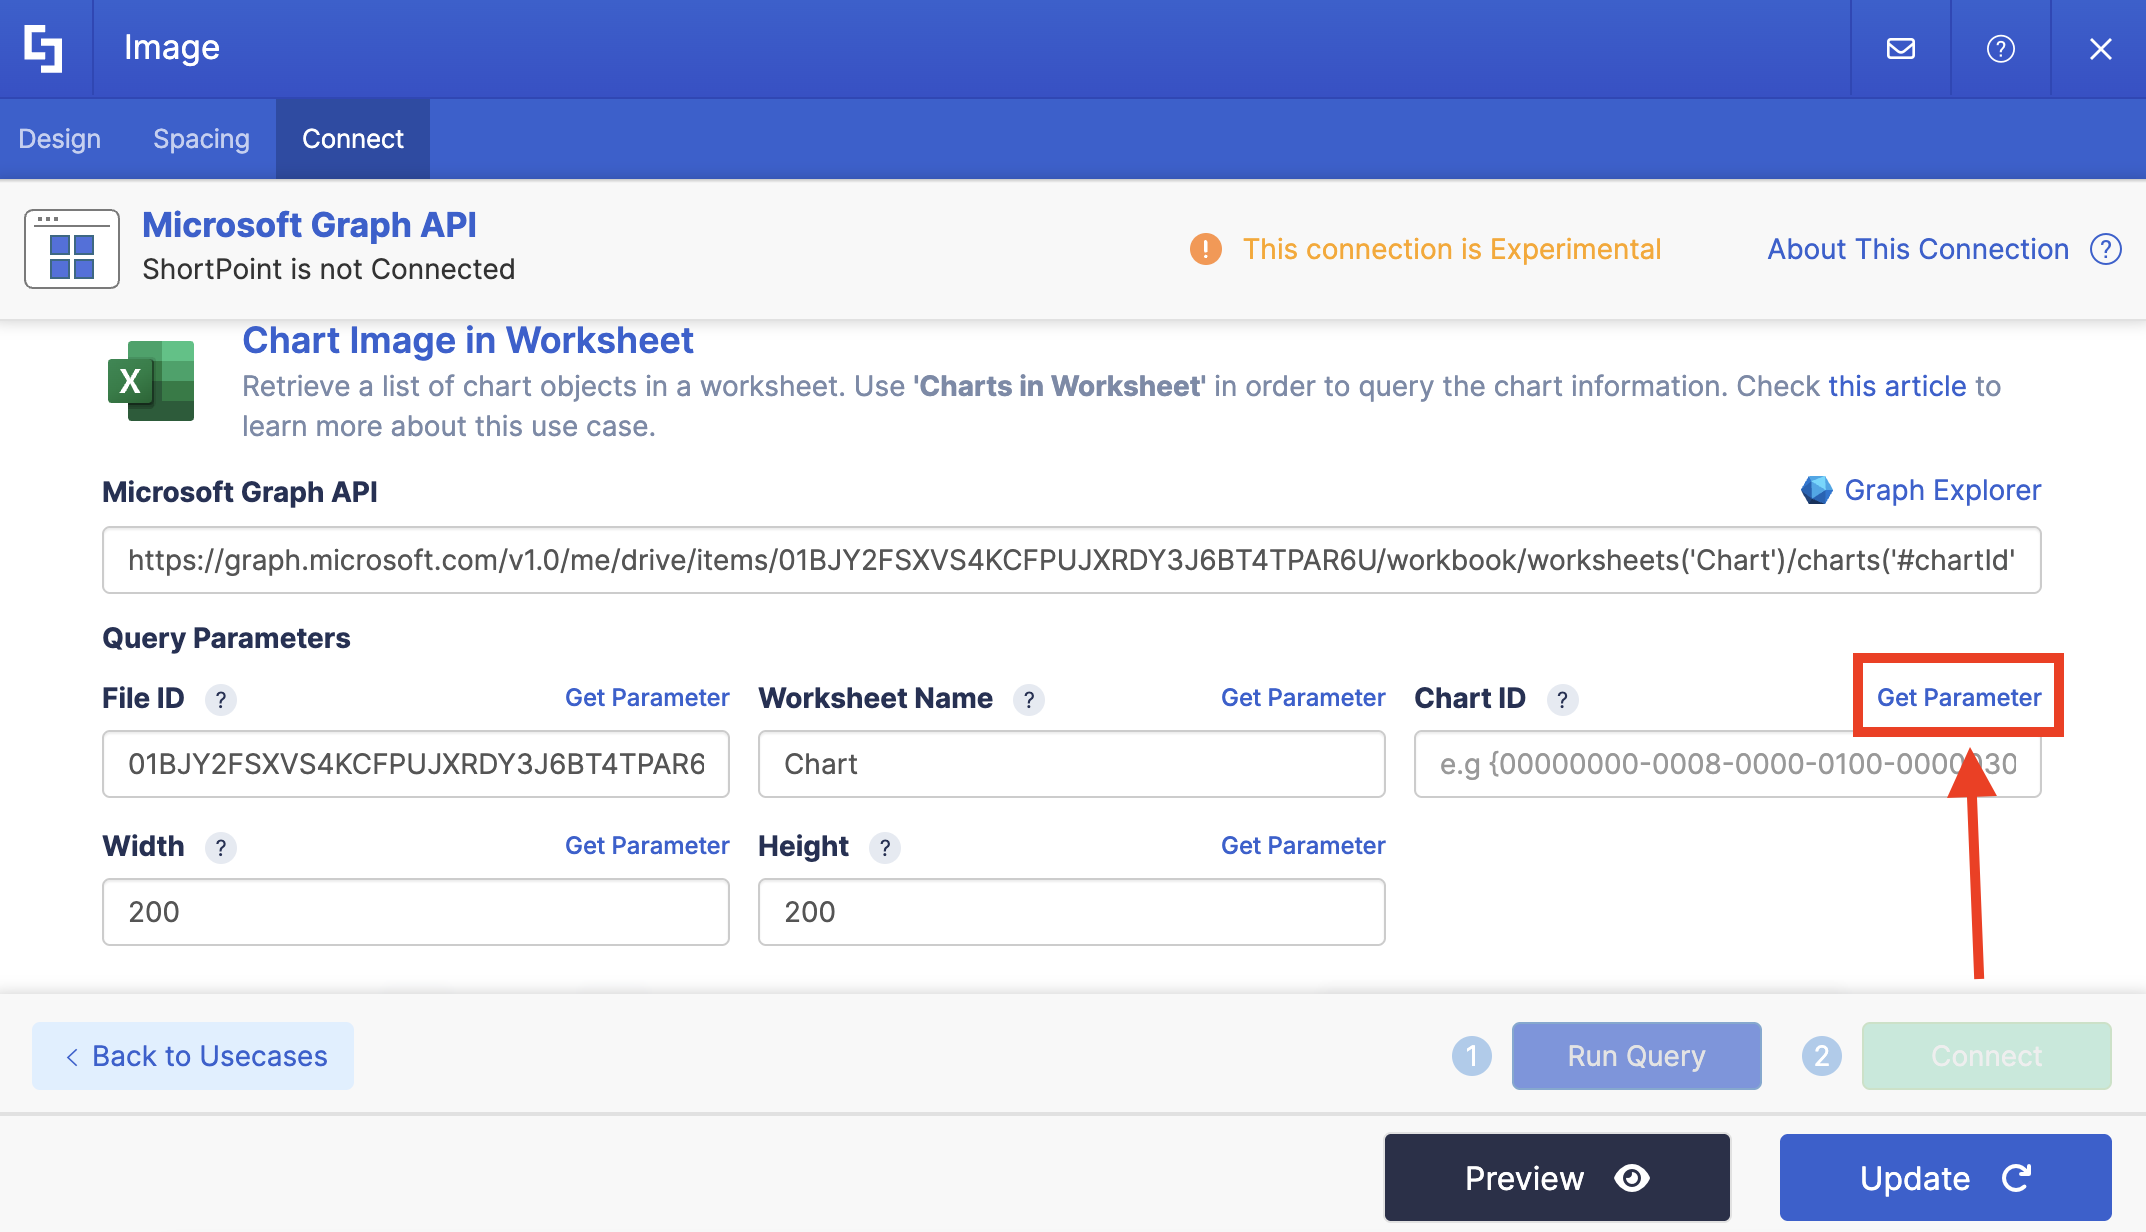
Step 8: Get Chart ID
Click Get Parameter next to Chart ID:
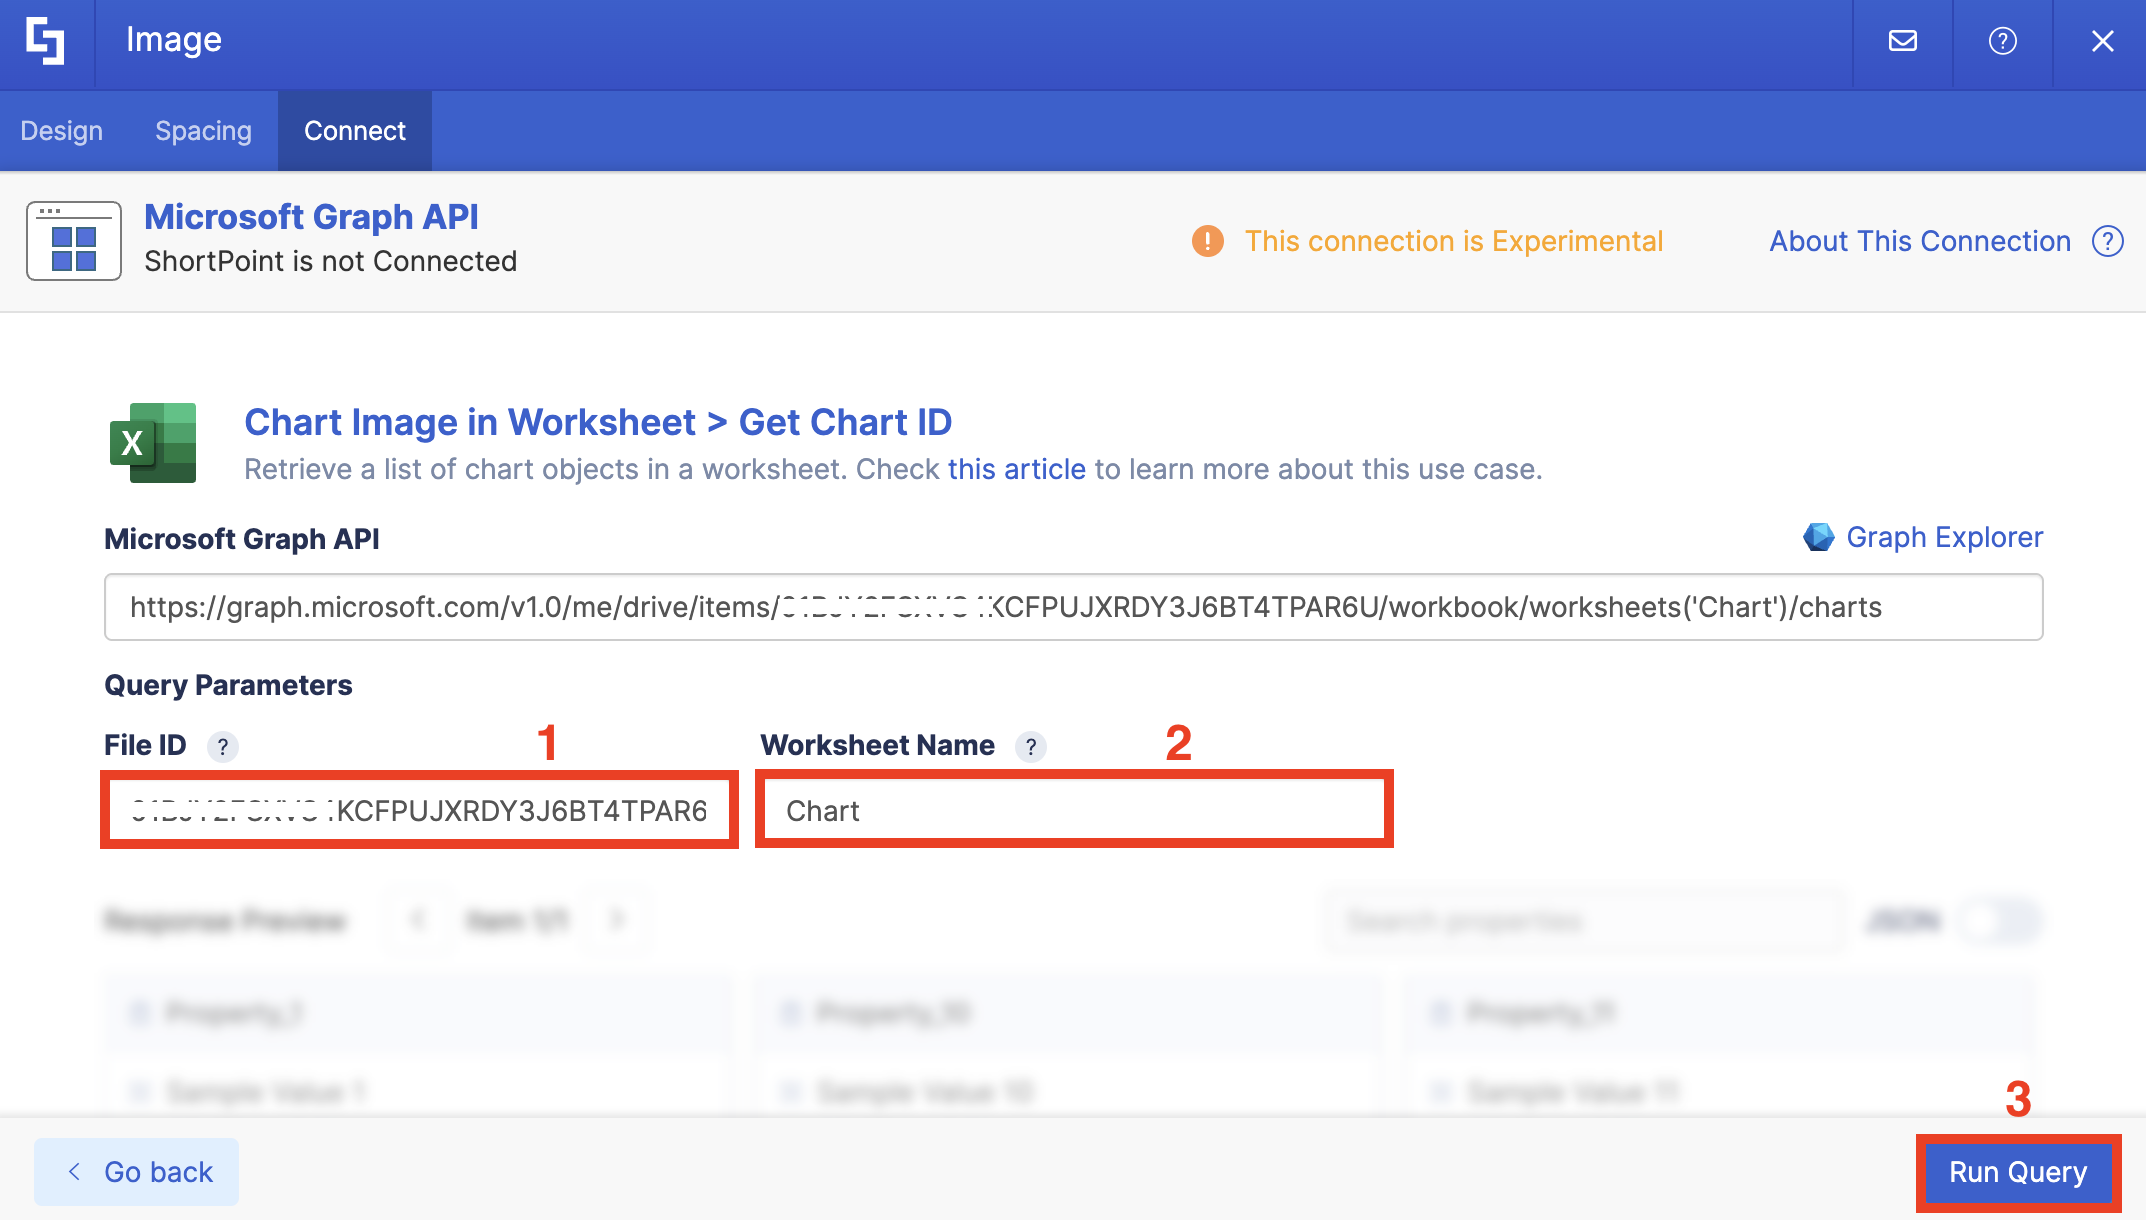
Paste the [1] File ID, write the [2] Worksheet Name, and click [3] Run Query:
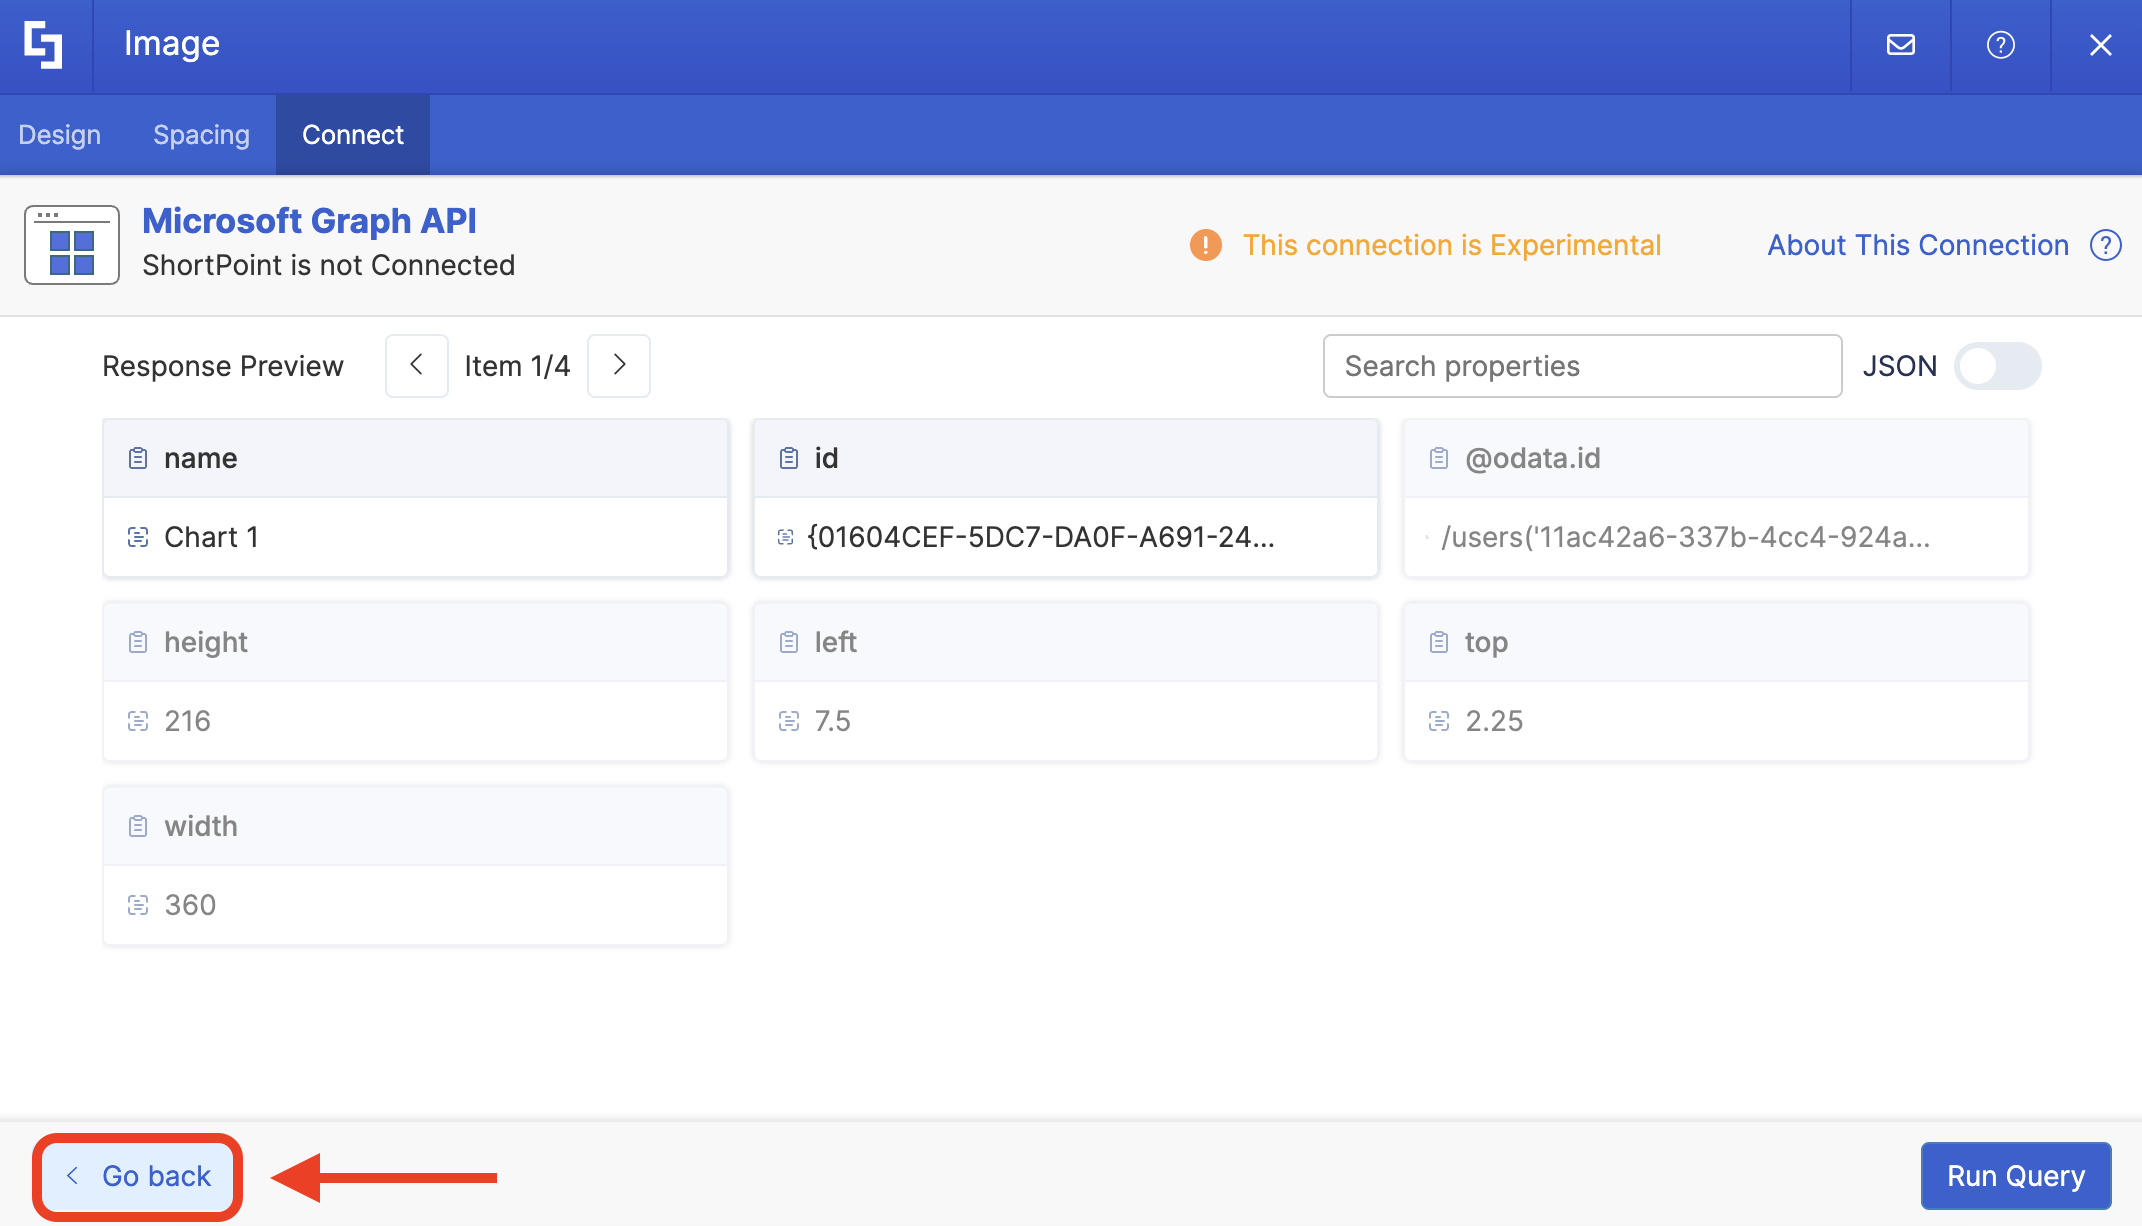
Look for the chart you want to display and copy its ID:
Click Go back:
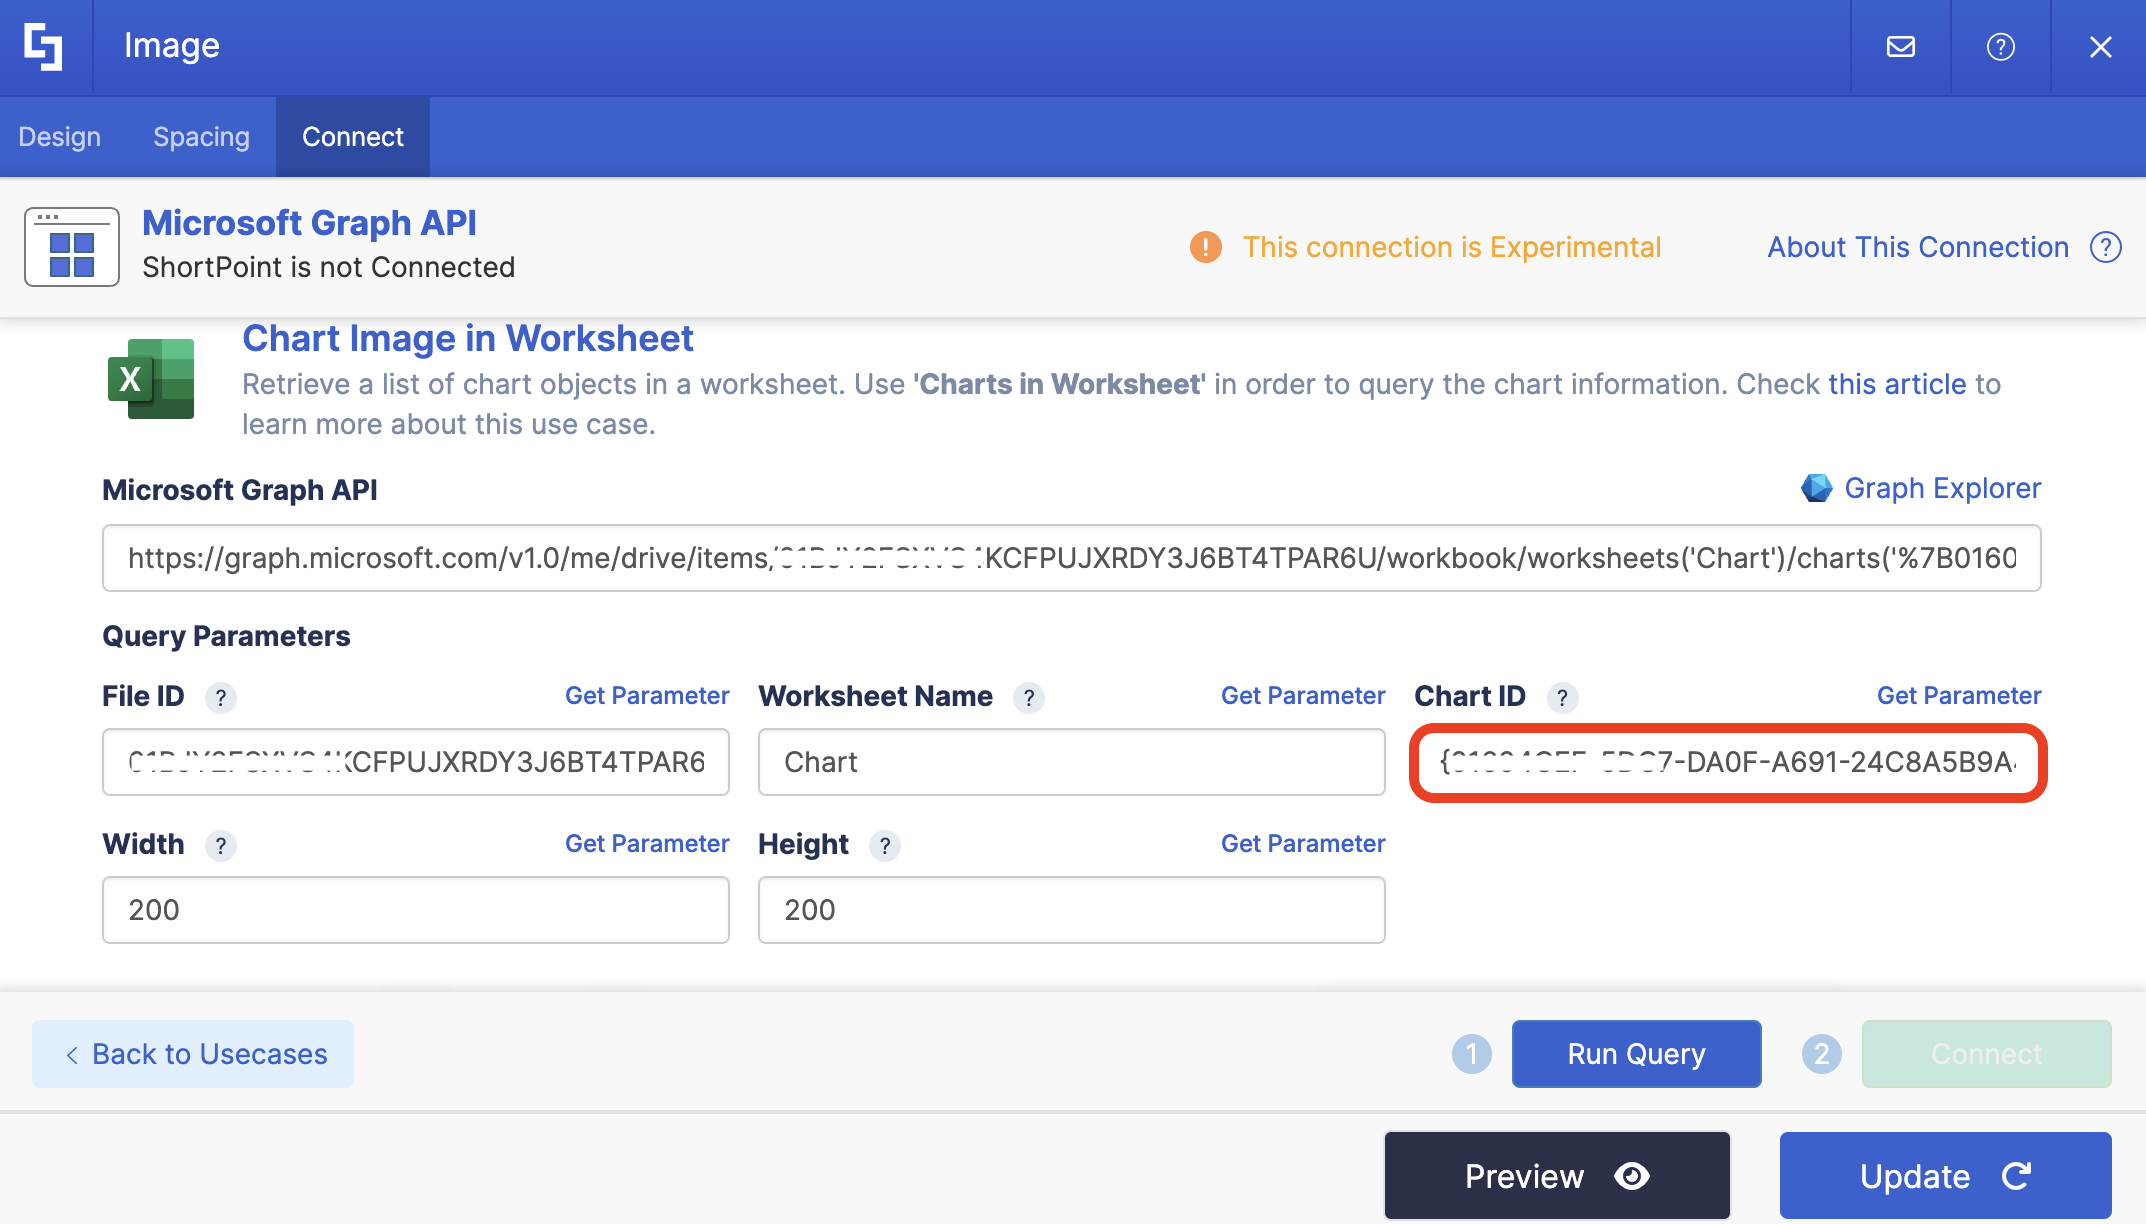
Paste the Chart ID in the field provided:
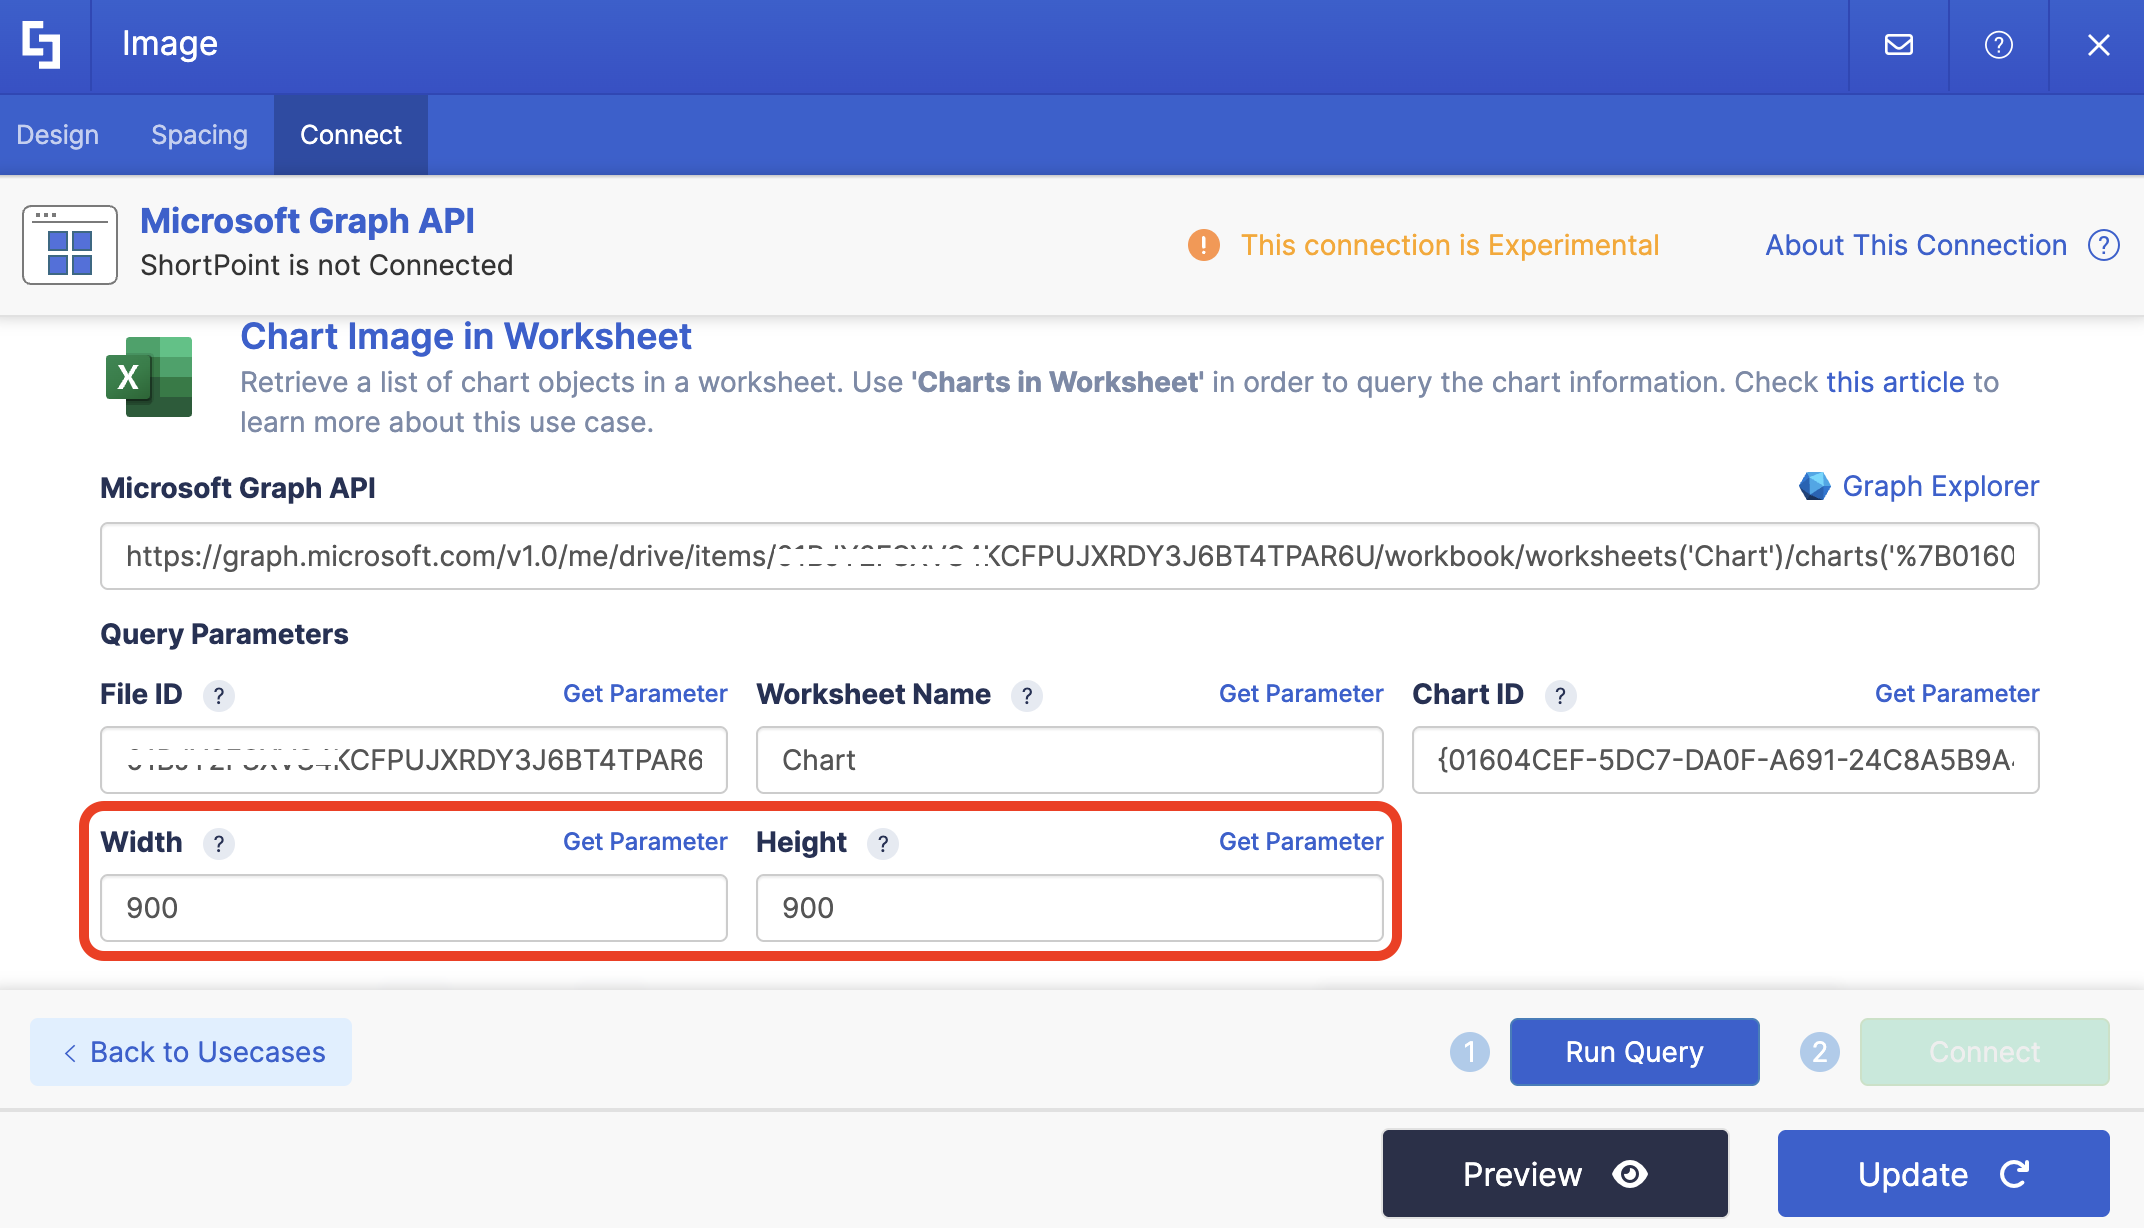
Step 9: Customize Height and Width
Write down the width and height values you want the chart to have. We recommend adding a higher value so the chart will not appear pixelated.
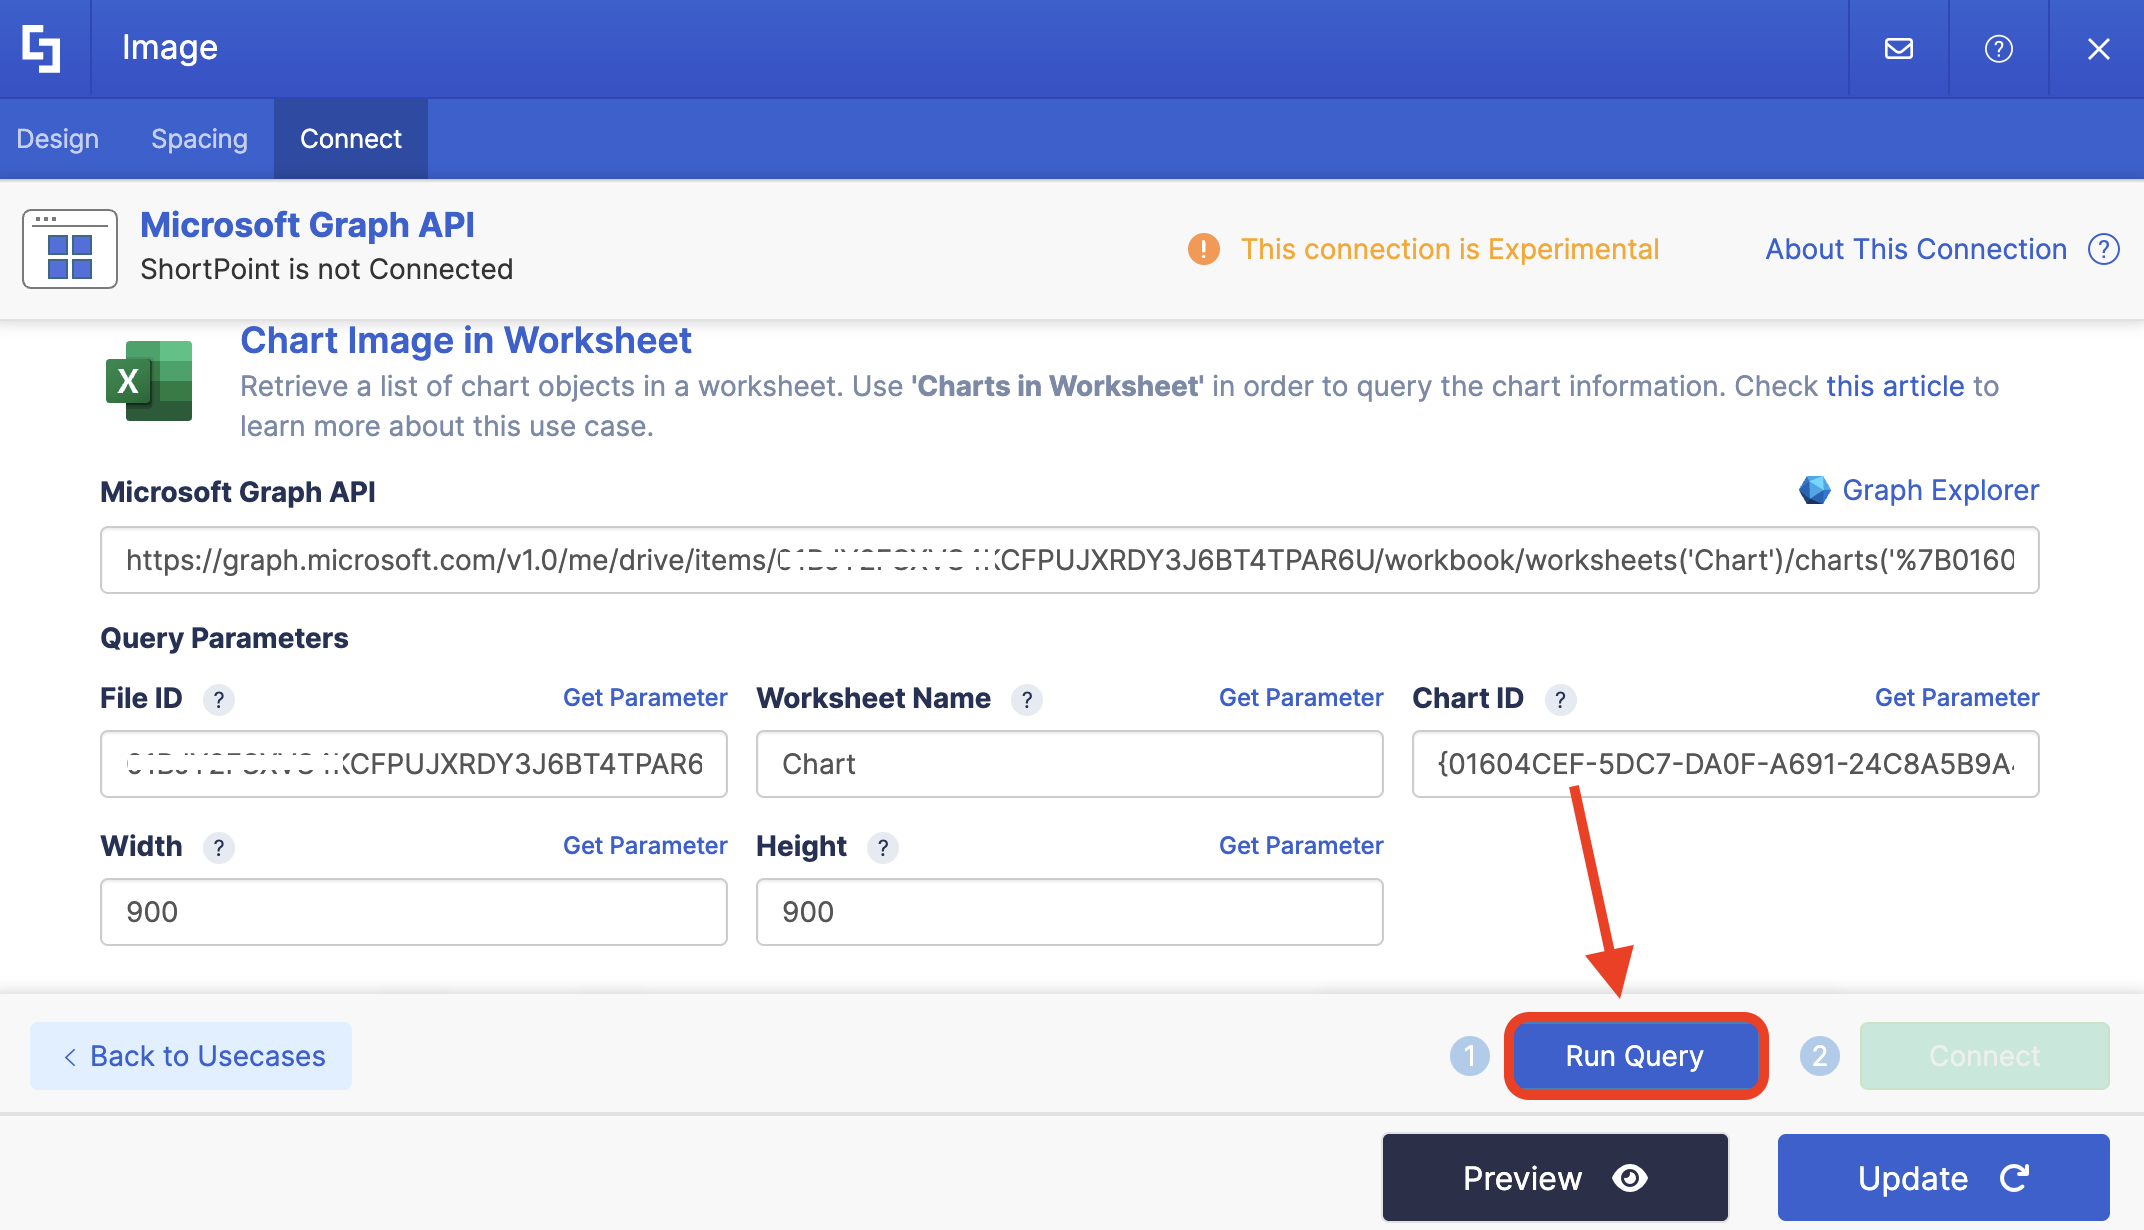
Step 10: Connect
Click Run Query:
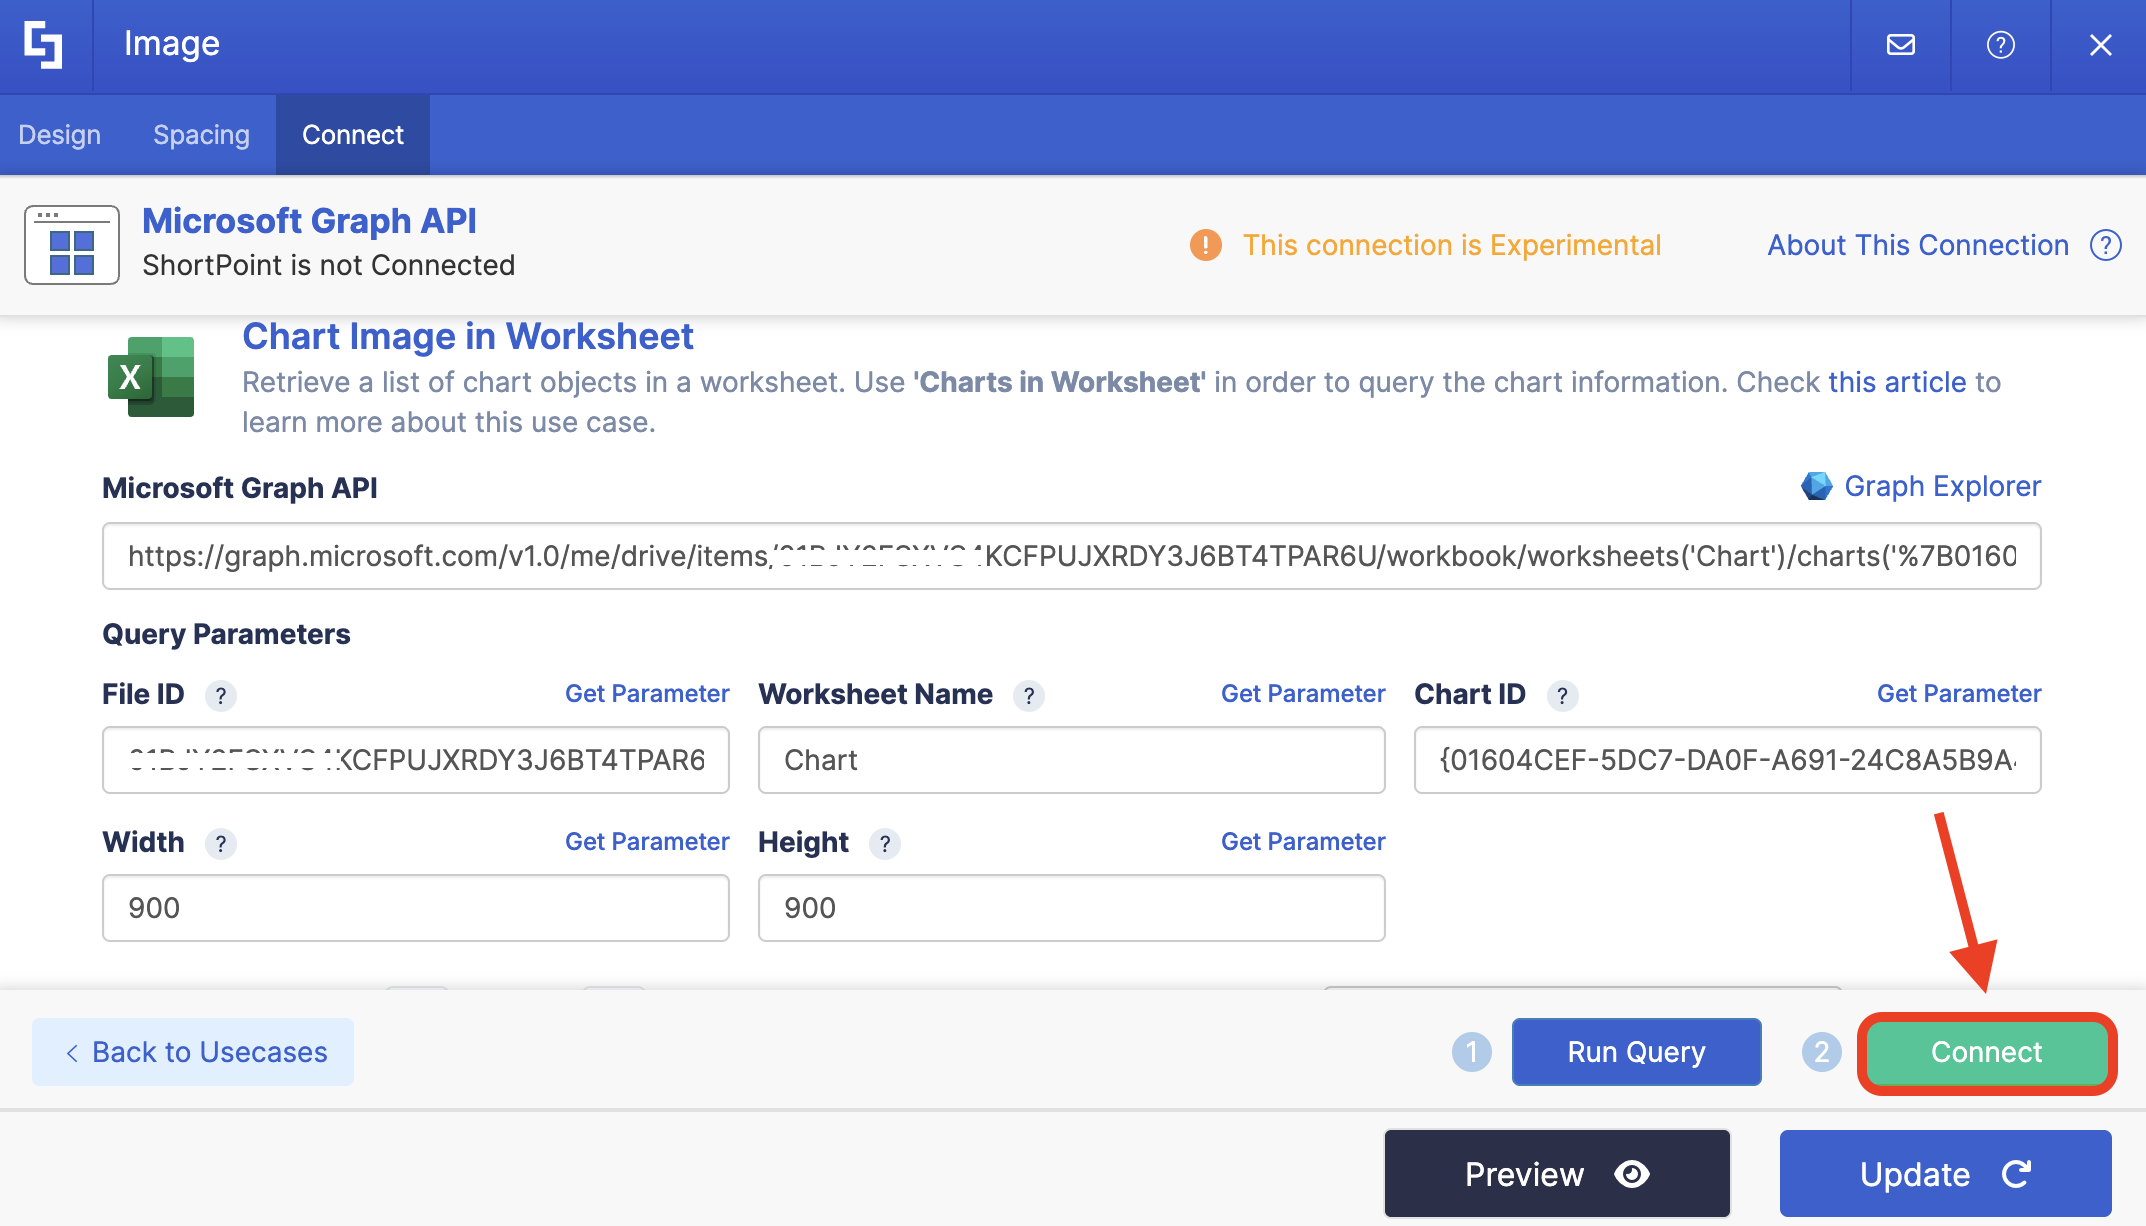
Select Connect:
Step 11: Map Items
Go to the Design tab:
NOTEIf you’re using any other Design Element, items mapping can usually be done in the Items tab. But, since we’re using the Image Design Element, it’s located in the Design tab.
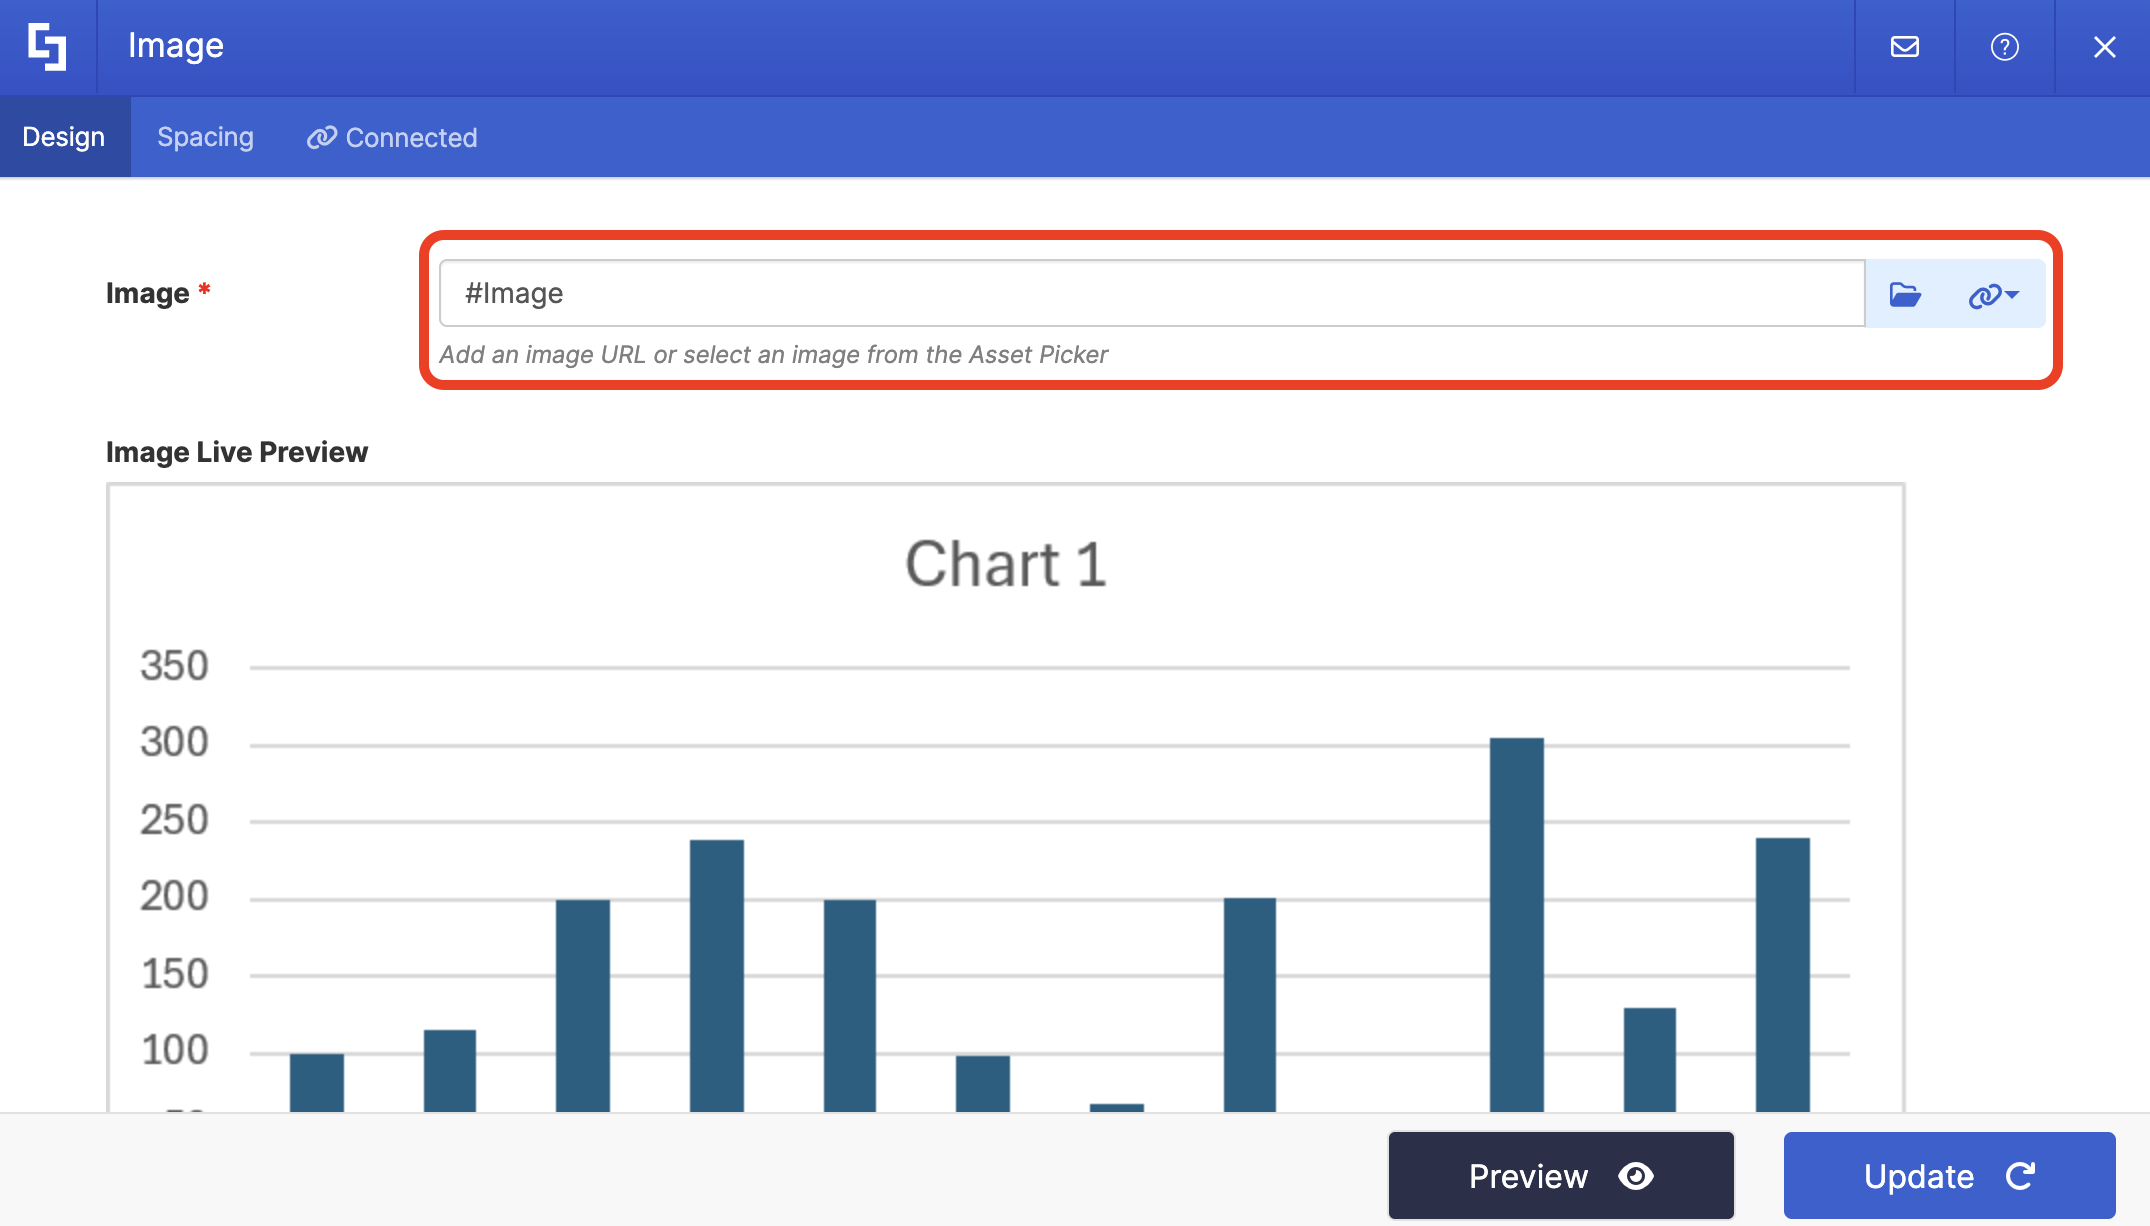
Delete default content and use the link icon to map the properties you want to be displayed:
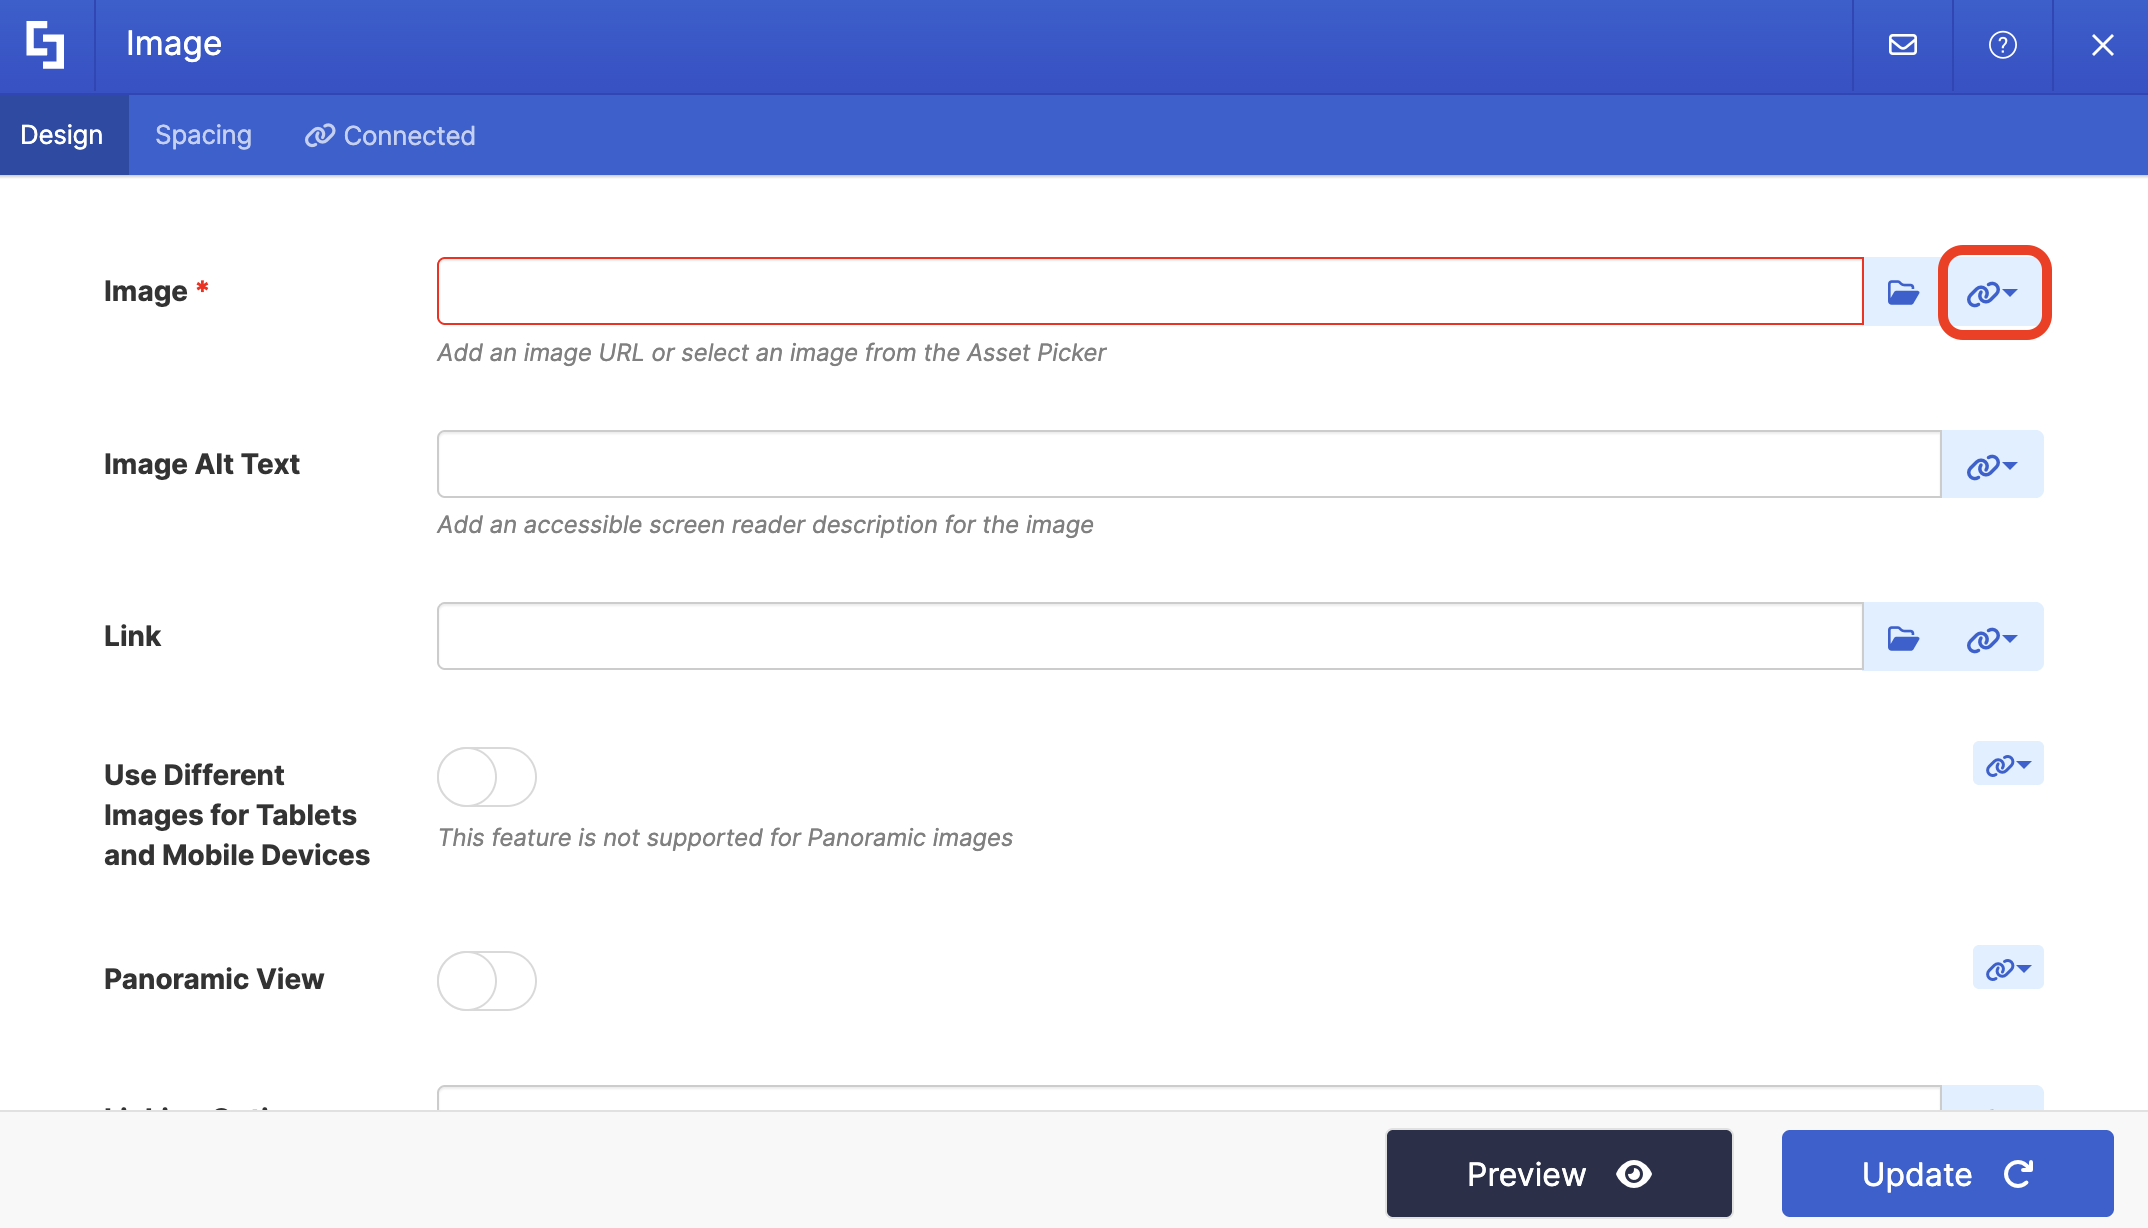
You can map any property you want. In our case, we used the following properties:
- #image - shows a photo of the chart
NOTECheck out ShortPoint Connect: How Items Mapping Works to learn more about mapping properties.
Step 12: Save
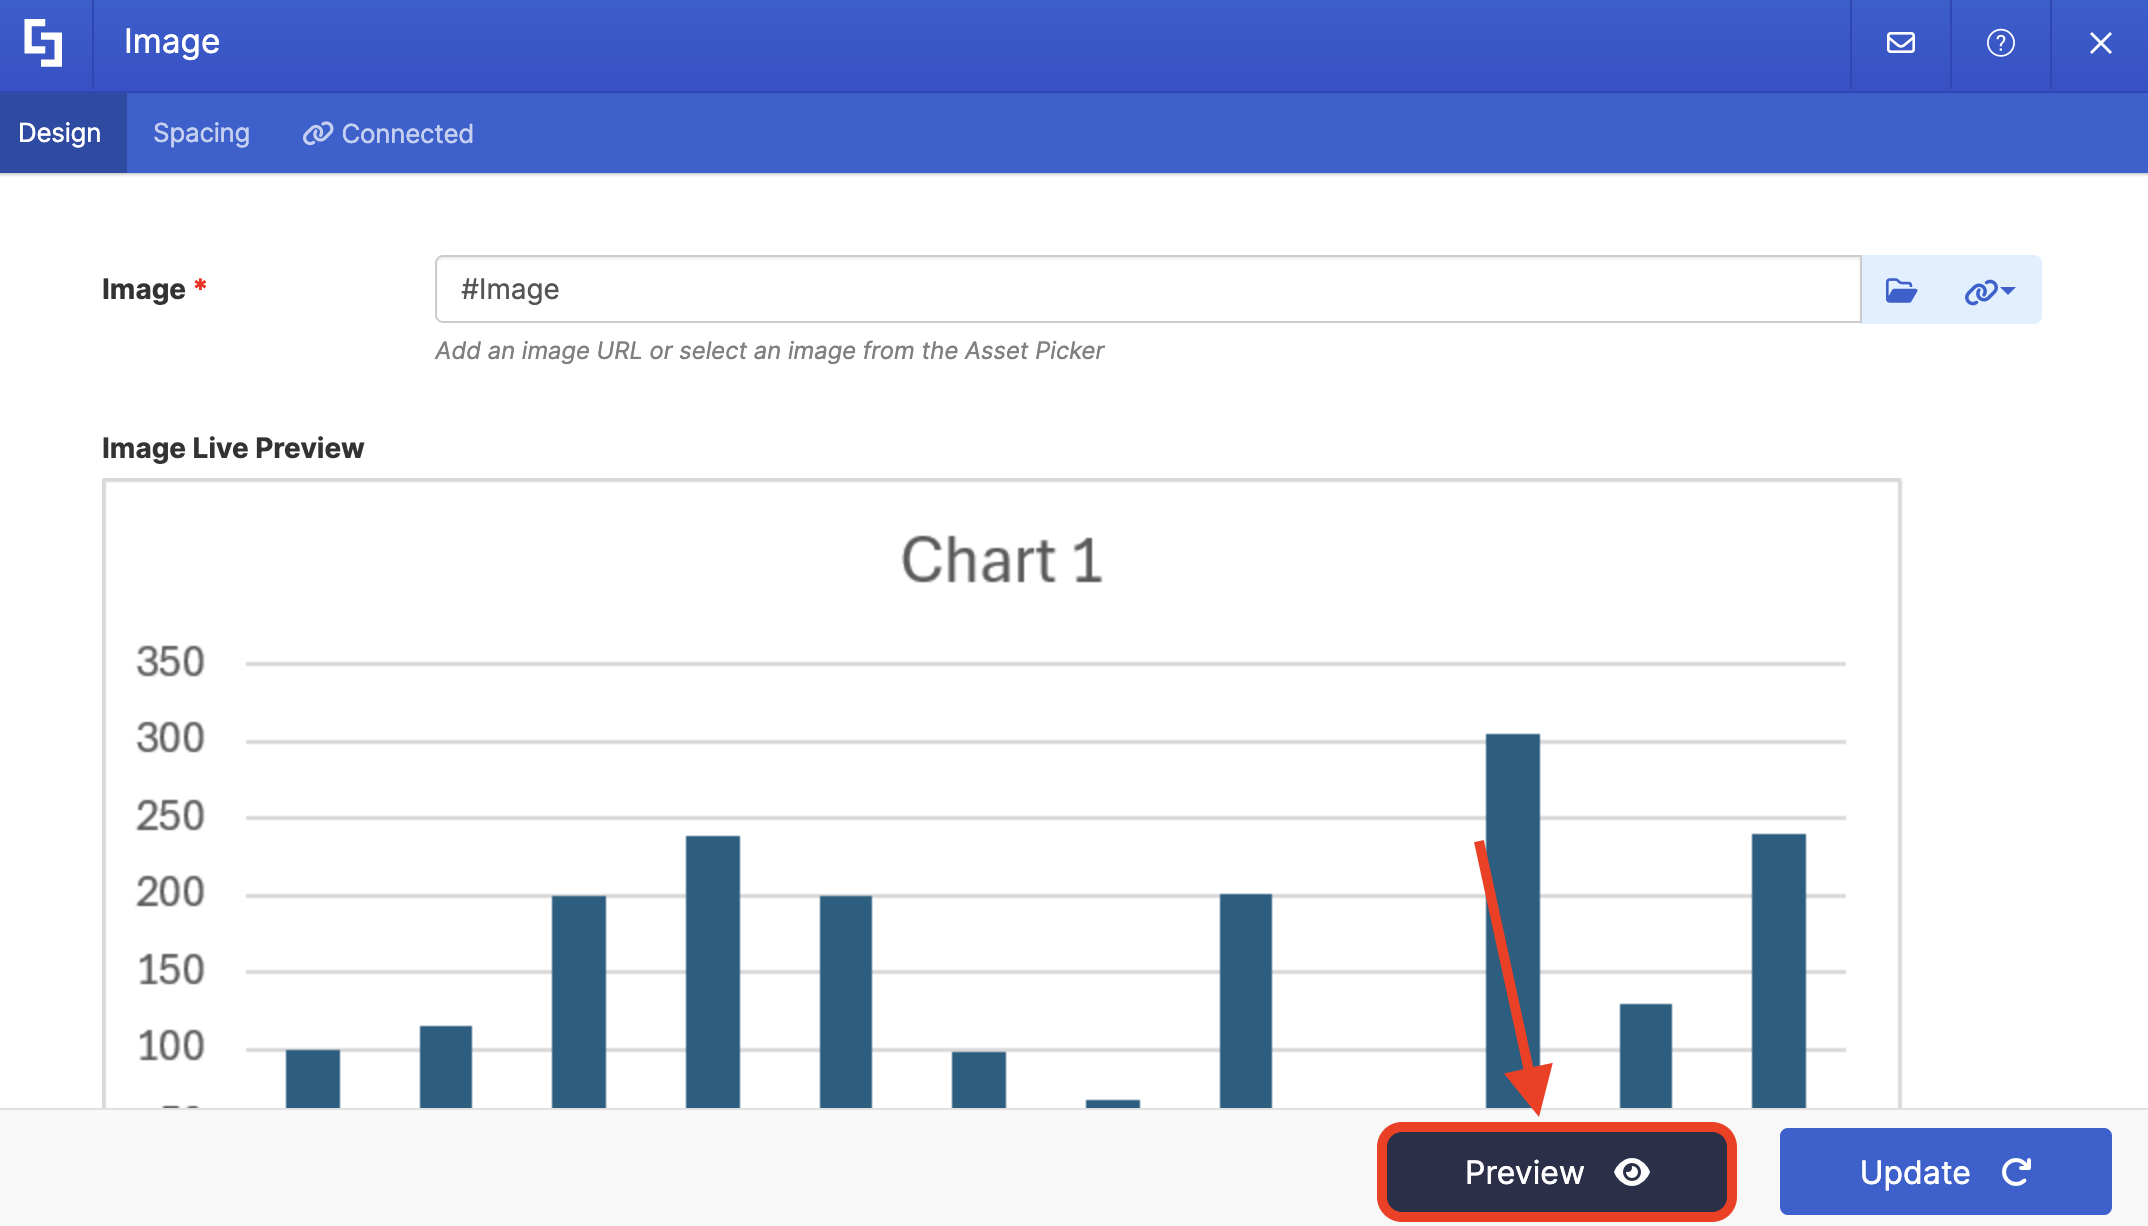
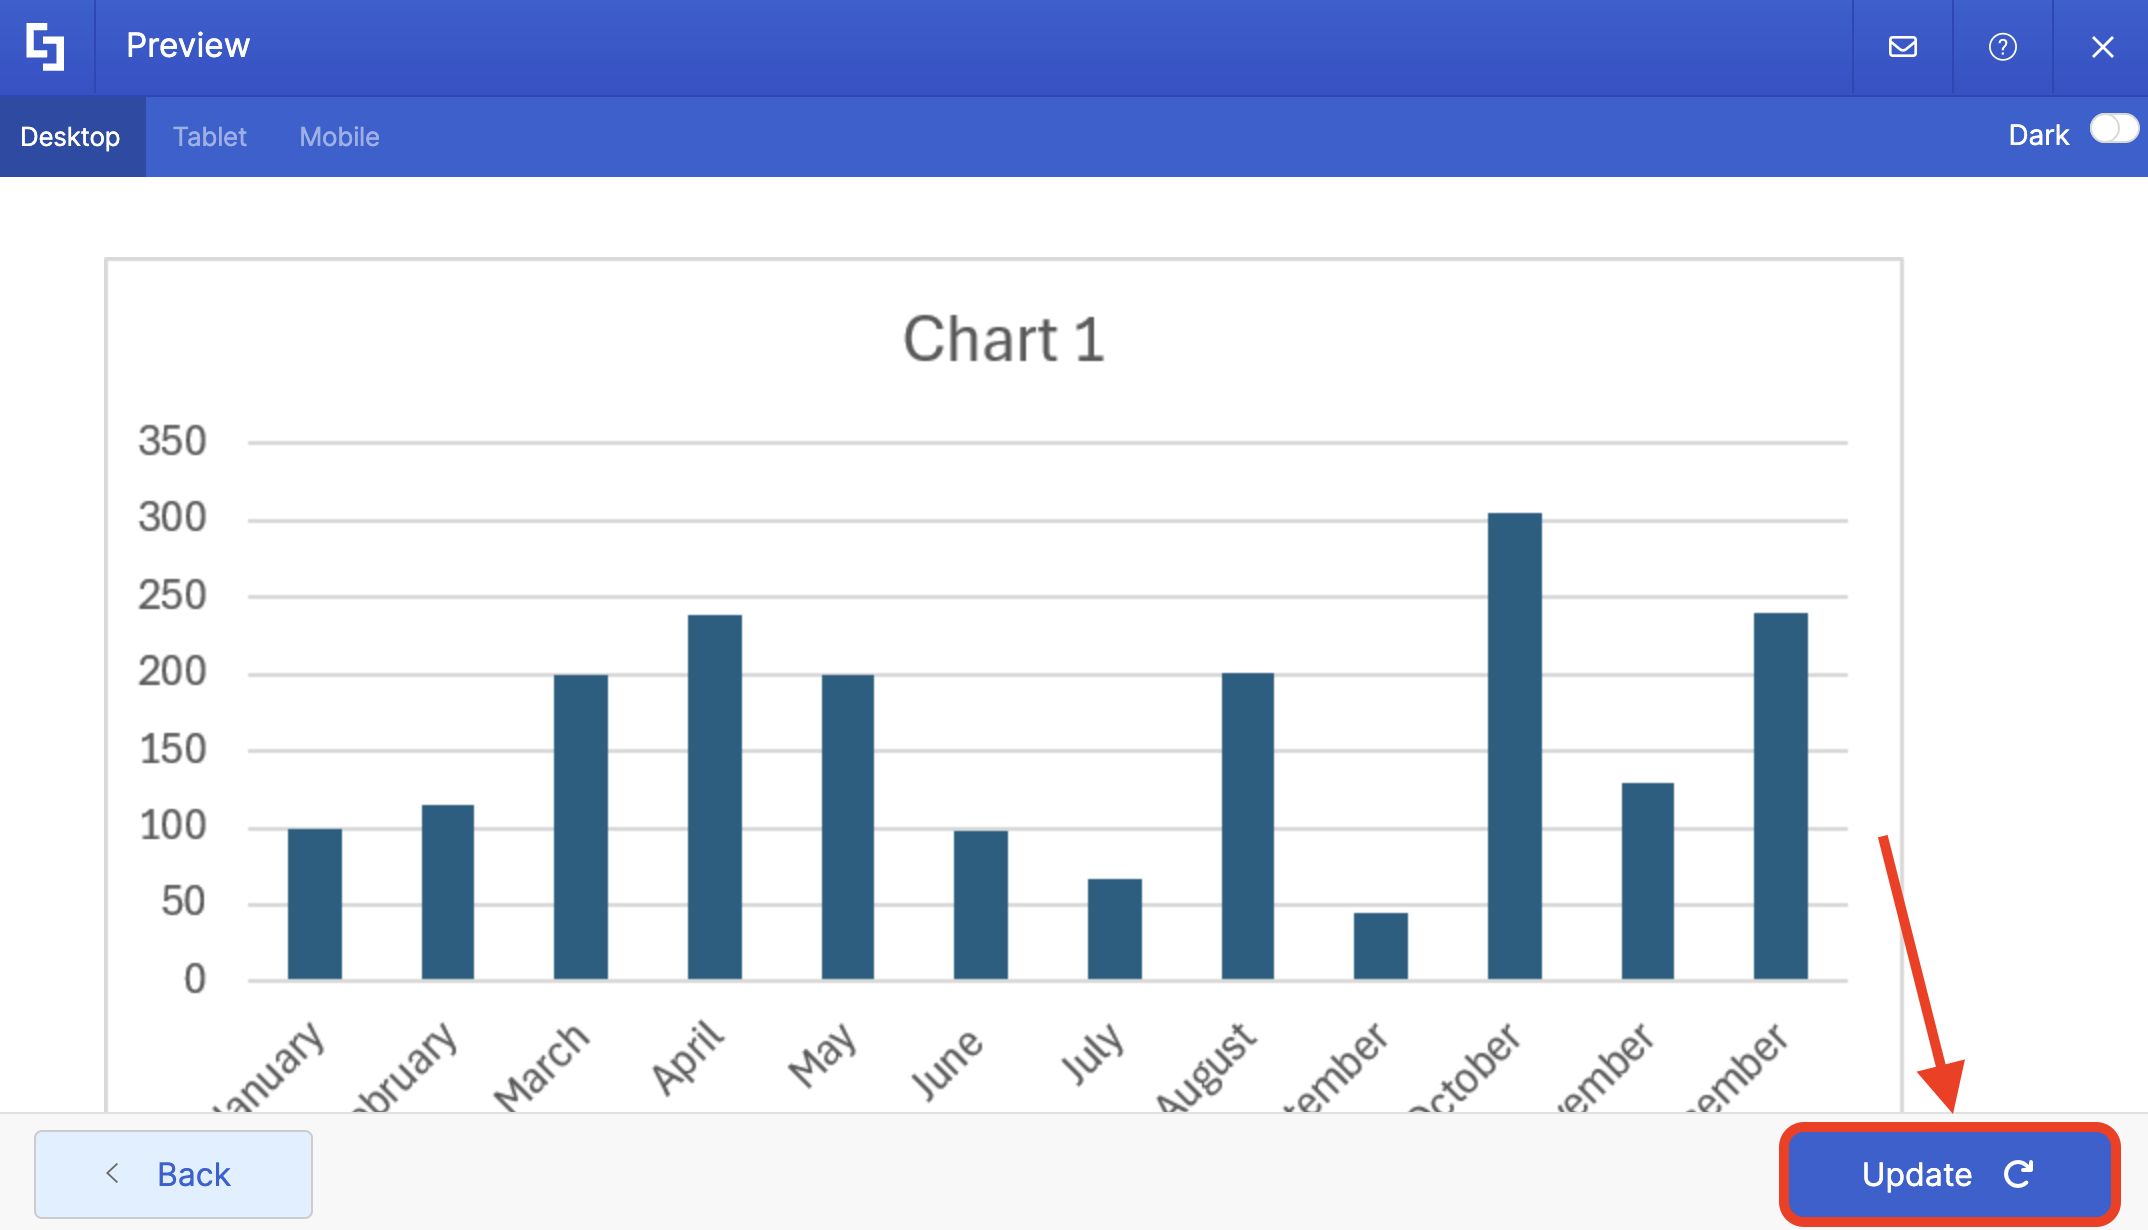
Click Preview to see how the Design Element will look:
Click Update to apply your changes:
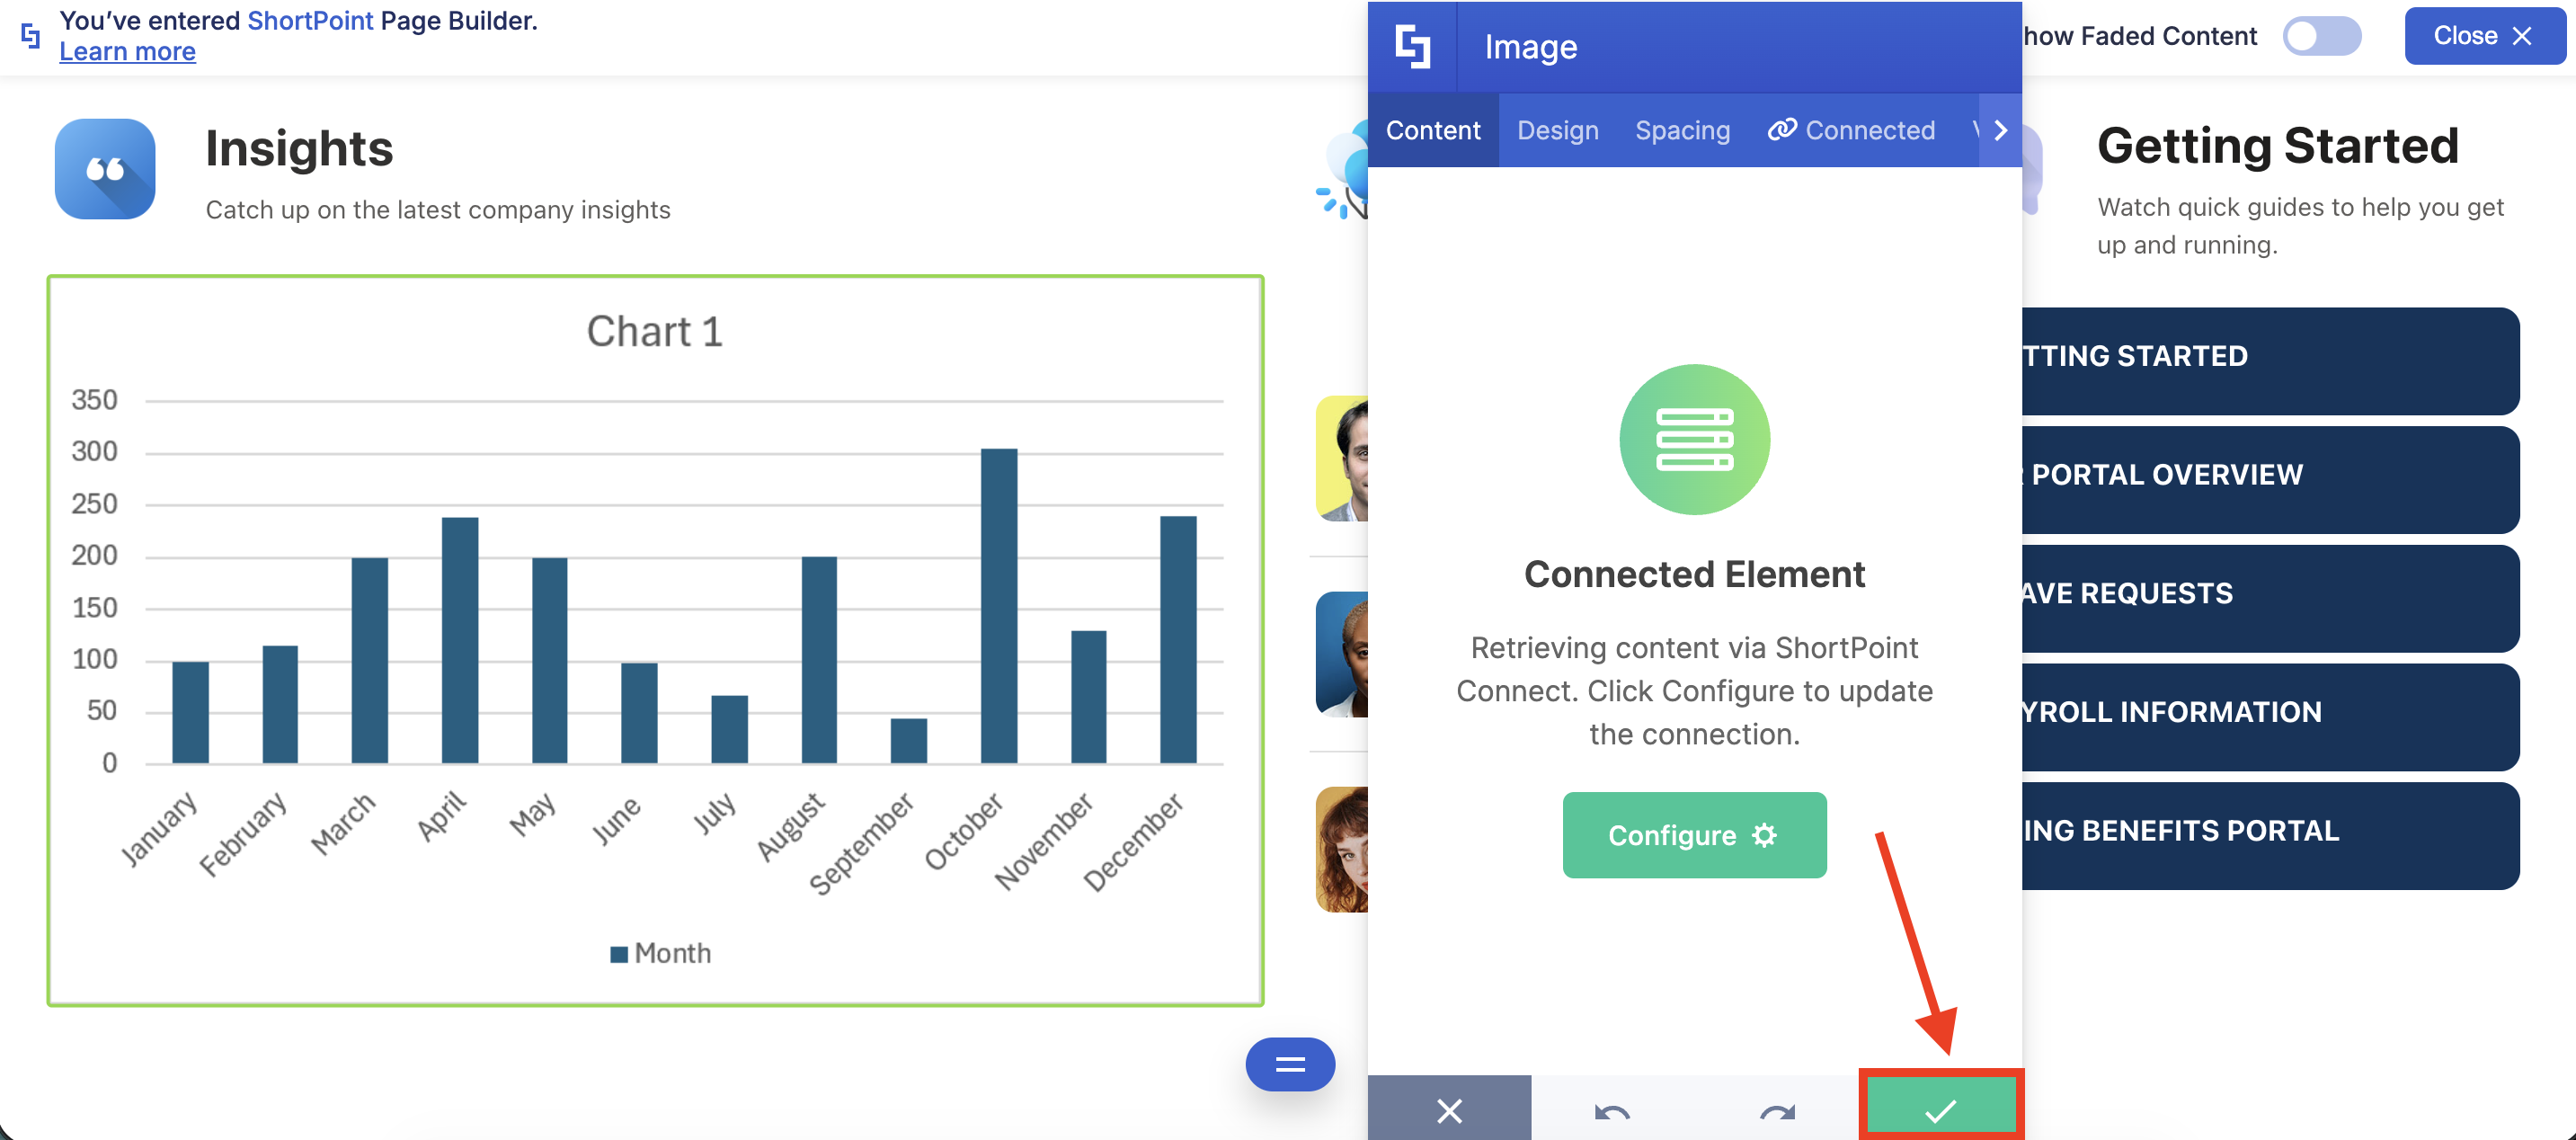
Click the green checkmark:
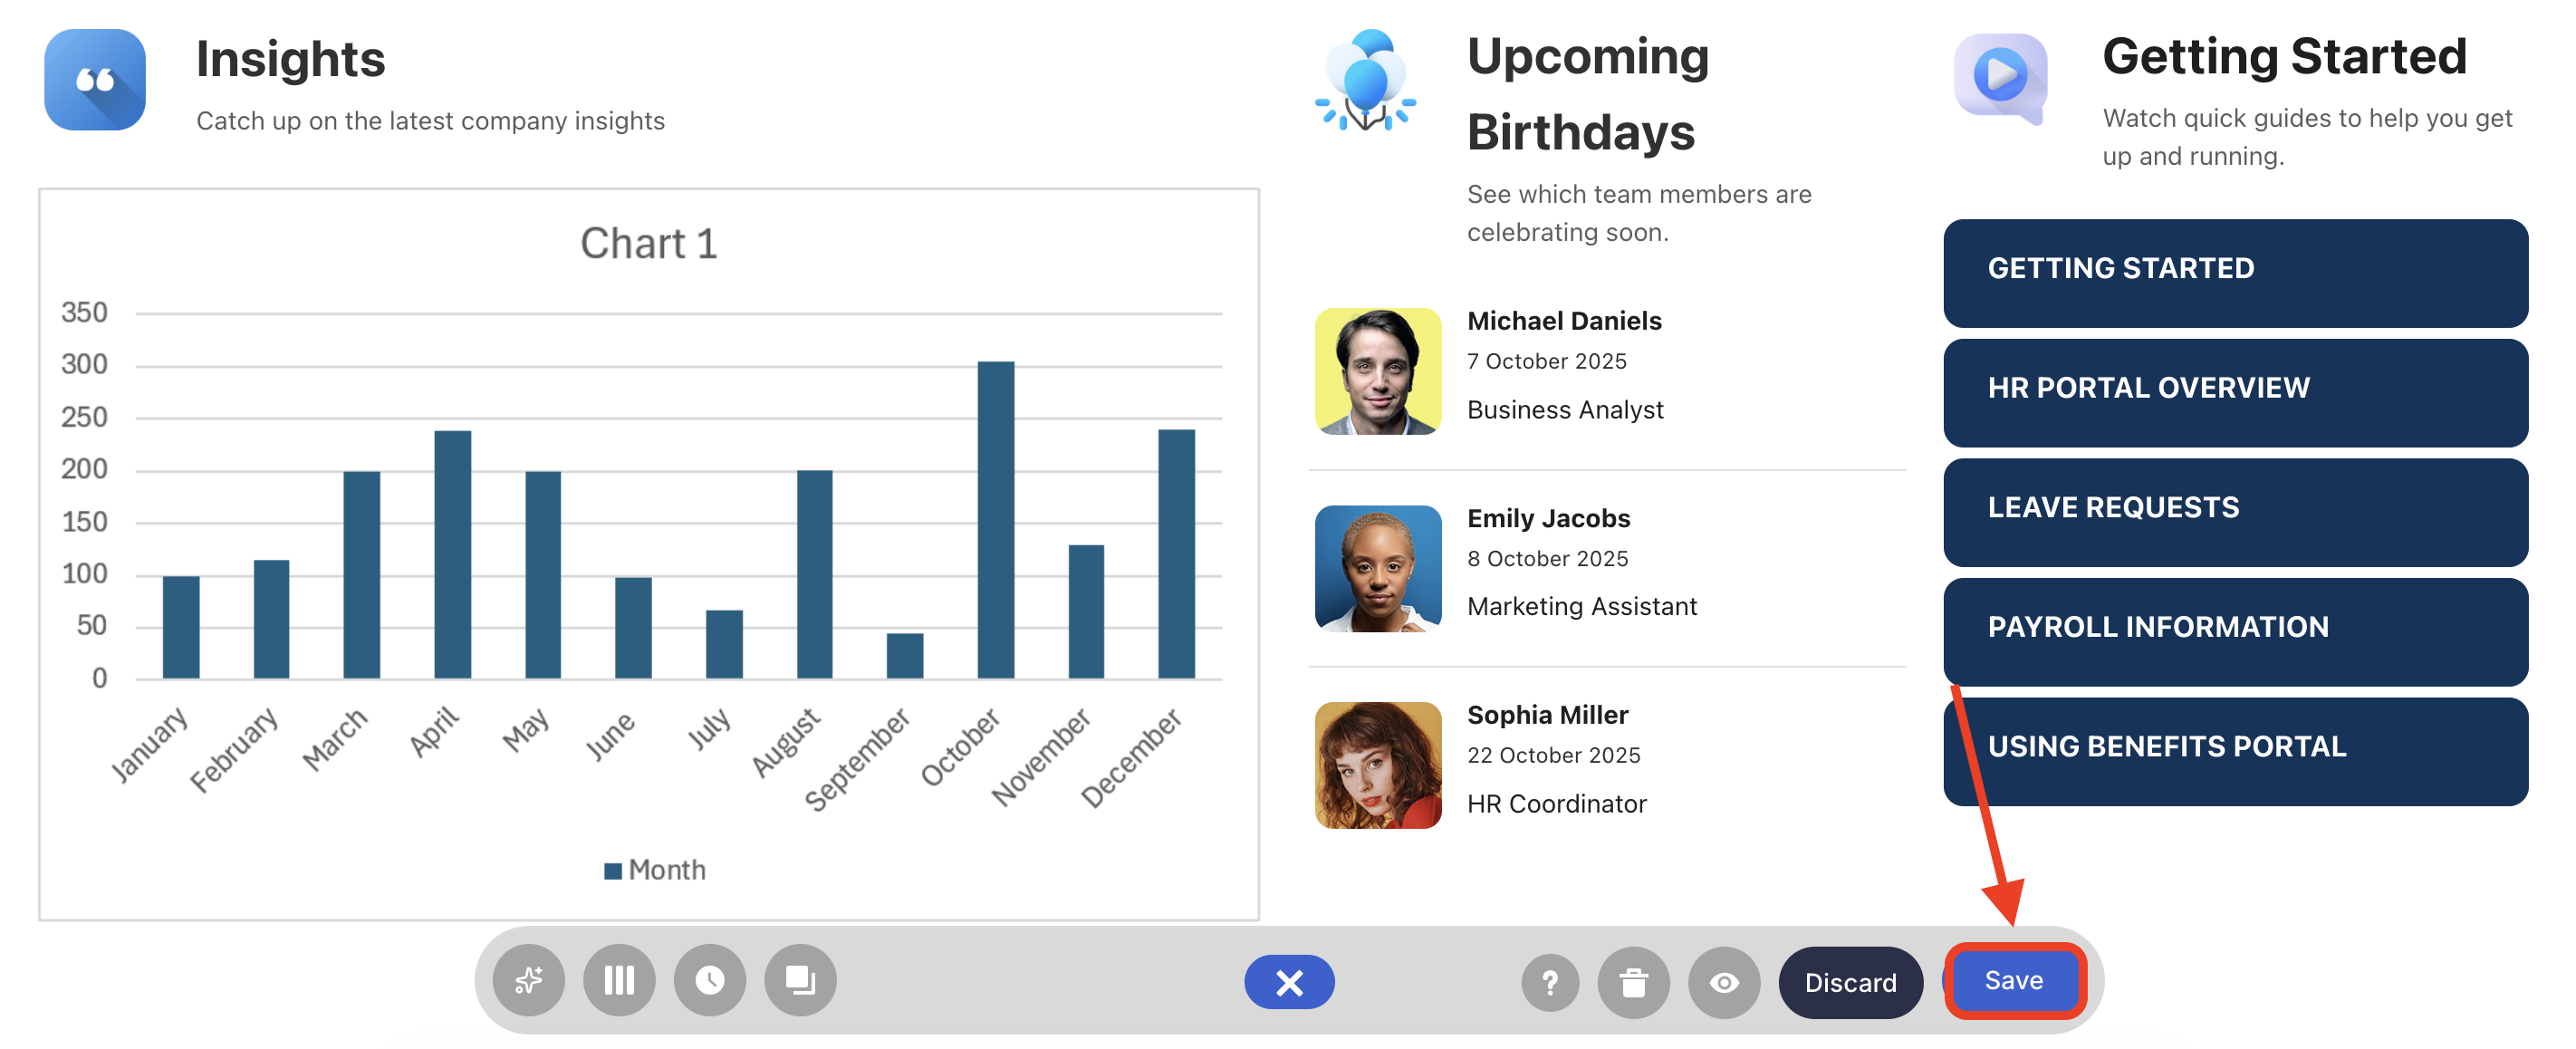
Once satisfied, click Save:
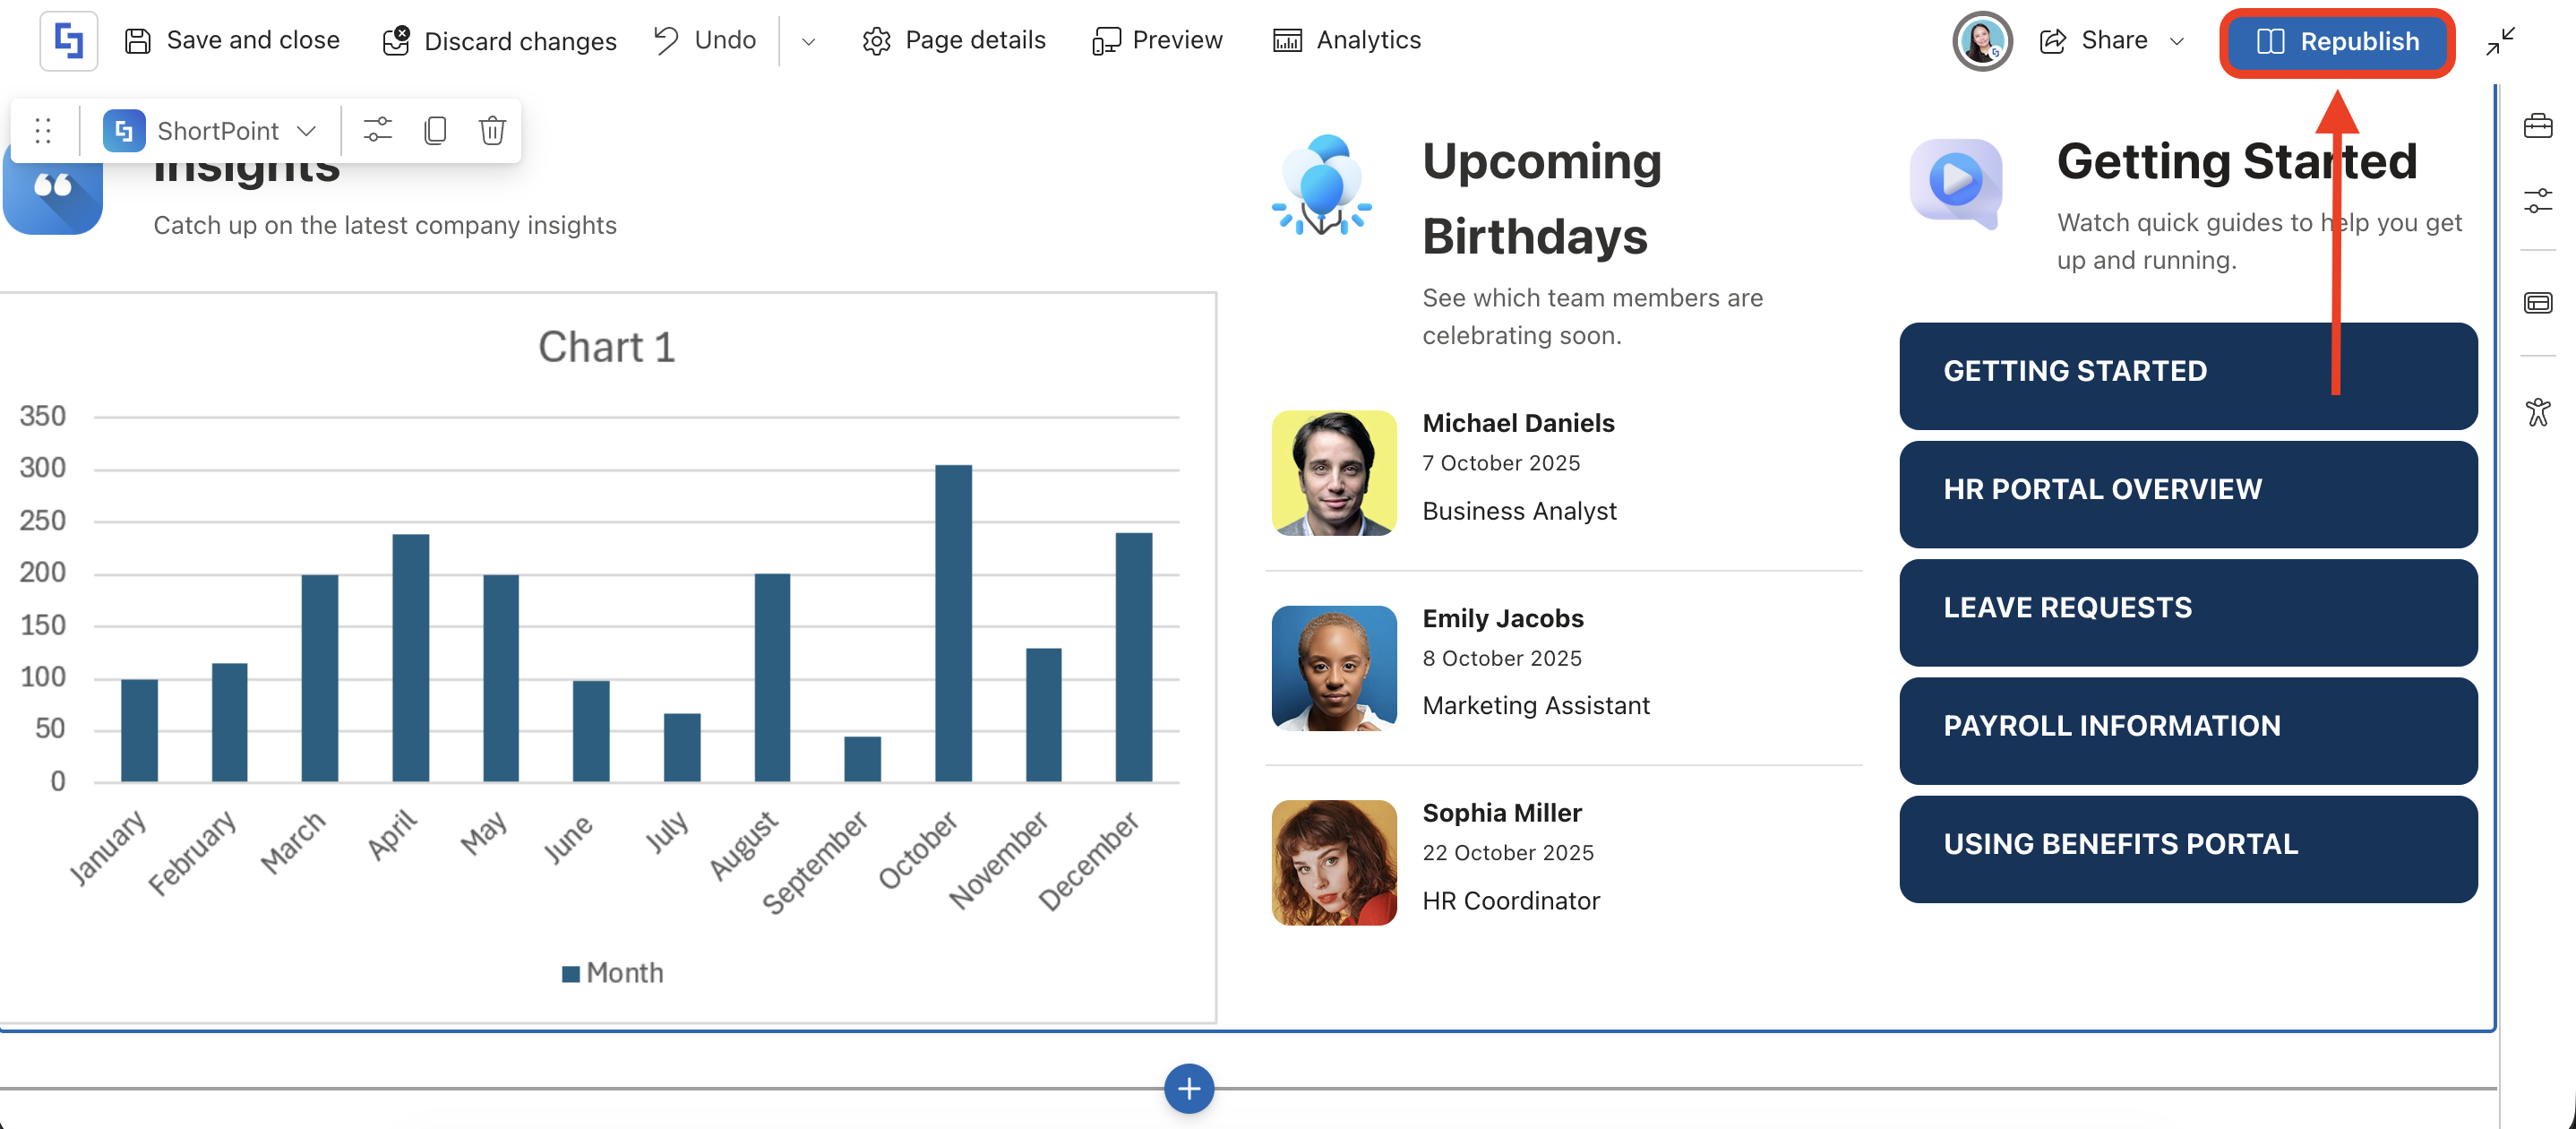
And Publish your page:
You're all set! You can now showcase interactive charts in SharePoint Online. This allows your organization to create dynamic dashboards and reports that bring your data to life. Enjoy the power of visual data directly on your SharePoint pages!
Frequently Asked Questions
Do users need Excel installed to see the charts?
No! Since the Graph API converts the chart into an image on the server side, users only need access to the SharePoint page. They don’t even need to open the Excel file itself or have Excel installed on their browser.
Does the chart update instantly when I change the Excel data?
Pretty much! However, there can be a slight lag of a few seconds as the Graph API processes the new data and refreshes the chart image.
What permissions do I need to set this up?
To pull these charts, you need to enable Files.Read permission in the SharePoint Admin Center > Advanced > API access.
Can I customize how the chart looks via the API?
You can control the width and height dimensions. However, the colors, fonts, and chart type are determined by the settings within the original Excel file.
Can I use this with the old .xls files?
No. The Microsoft Graph Excel API only supports the modern Office Open XML format (.xlsx). If you have older files, you’ll need to convert them first.
Related articles:
- How to Enable Microsoft Graph Integration for MS Graph API Connections
- Microsoft Graph API: Supported and Non-Supported Endpoints
- Getting Started With Microsoft Graph API Use Cases
